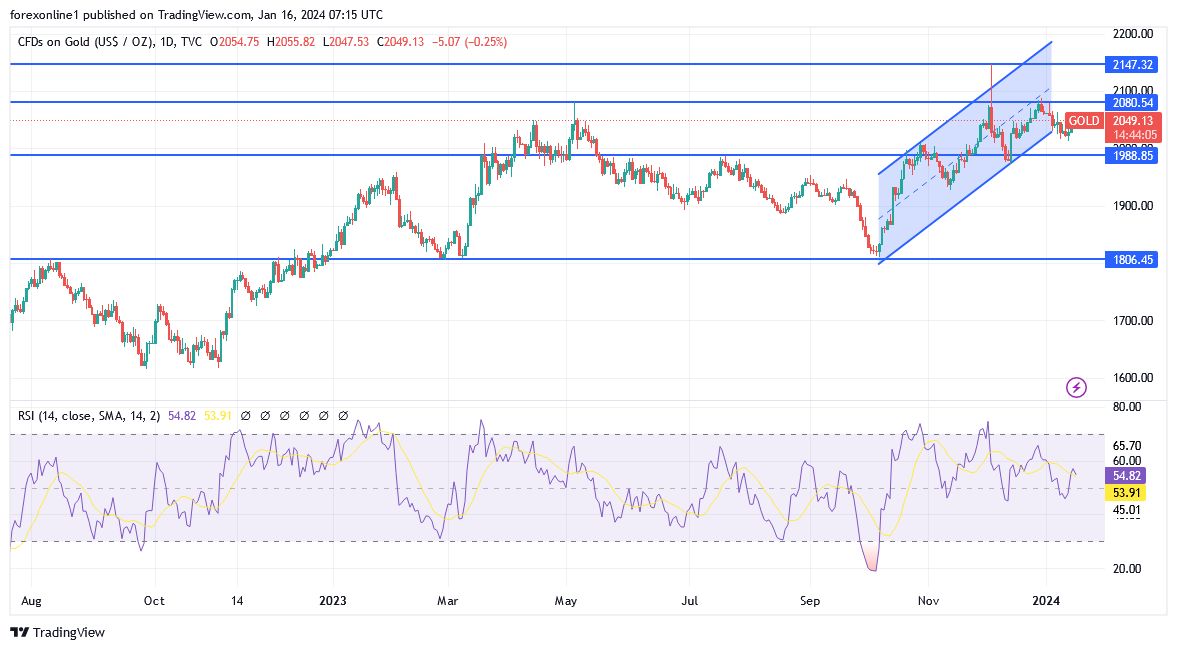
- Despite the strength of the US dollar, the price of gold (XAU/USD) shows stability, as it stabilizes around the level of $2055 per ounce at the time of writing the analysis.
- For three trading sessions in a row, the gold price has been trying to complete the rebound upwards but awaits new stimulus.
- Global geopolitical tensions, especially from the Middle East, continue to support the gold market. Relatively, the price of gold performed well in 2023, even as its performance lagged behind the performance of major assets such as the Dow Jones, Nasdaq 100, and Standard & Poor's 500.
- Historically, the price of gold jumped by about 12.6% during the year 2023 and reached its highest level ever at $2,145.

Will Gold Prices Fall in the Coming Days?
We expect that the price of gold will continue to perform well in 2024 for three reasons. Firstly, geopolitical risks are still on the rise. Iran has sent its warships to the Red Sea amid the ongoing crisis in the region, risking the possibility of a comprehensive war involving US ships. Gold is often considered a good hedge against such risks.
Secondly, it is expected that the US public debt will continue to rise in the coming months. Data indicates that the country's public debt has jumped to over $33.9 trillion, after surpassing the $33 trillion level a few months ago. Therefore, this means that the country's debt burden will end the year at around $35 trillion.
Thirdly, the Federal Reserve has signaled interest rate cuts in the United States in 2024. Significantly, this is a change since the central bank raised interest rates in the past two years, pushing them to their highest levels in two decades in an attempt to combat inflation. Shortly, gold tends to perform well when the Federal Reserve cuts interest rates.
Finally, technical indicators support the upward trend in gold price. On the weekly chart, we see that gold is stuck at an important level, above which it has failed since August 2020. This means that it has formed a triple top pattern, which is a bearish signal. However, it has also formed an inverted head and shoulders pattern, the neckline of which is at $2,080. Therefore, a move above the all-time high at $2,145 would be a bullish signal. This will invalidate the triple top pattern and move much higher.
Top Regulated Brokers
Gold Price Forecast and Analysis Today:
So far, the overall trend for the gold price (XAU/USD) remains bullish and may continue for some time as global geopolitical tensions increase alongside more central bank purchases of the yellow metal for hedging. According to the current trend, the nearest resistance levels are $2065, $2077, and $2085, respectively. From these levels, technical indicators are expected to show strong buying saturation signals. According to the performance on the daily timeframe chart below, there will be no real shift to a bearish gold trend without moving towards support levels at $2000 and $1985 per ounce, respectively.
Ready to trade our Gold price forecast? We’ve made a list of the best Gold trading platforms worth trading with.
