Top Regulated Brokers
The difference between success and failure in Forex / CFD trading is highly likely to depend mostly upon which assets you choose to trade each week and in which direction, and not on the exact methods you might use to determine trade entries and exits.
So, when starting the week, it is a good idea to look at the big picture of what is developing in the market as a whole, and how such developments and affected by macro fundamentals, technical factors, and market sentiment.
Read on to get my weekly analysis below.
Fundamental Analysis & Market Sentiment
I wrote in my previous piece on 22nd October that the best trade opportunities for the week were likely to be:
- Long of the USD/JPY currency pair following a strongly bullish daily close above ¥150. We got this close on Wednesday, but unfortunately the price of this currency pair ended the week down by 0.40% from there.
- Long of Gold following a new strongly bullish daily close above $2,000. This did not set up until the end of the week, so it was not a triggered signal.
- Day trades short of NZD/USD. This was a good call, as this currency pair ended the week 0.38% lower.
Last week overall saw a continuation of risk-off sentiment, driven partly by expectations that US interest rates will remain elevated for longer than was expected earlier, and partly by the continuing war in the middle east between Israel and Gaza which could widen dramatically at any point. The US Dollar and Gold were major gainers as safe havens. This is likely to continue as the new week begins, at least until Wednesday when we will get some releases of important US economic data including the non-farm payrolls forecast.
Last week was reasonably busy in terms of major data releases, with the major event being the US Advance GDP data which showed stronger than expected economic growth in the US economy (an annualized growth rate of 4.9% compared to the 4.5% which was expected), raising the case for a more hawkish Fed. The US Core PCE Price Index, which tends to be seen as a leading indicator for inflation, showed a monthly increase of 0.3% as expected. The European Central Bank left its main refinancing rate unchanged, as did the Bank of Canada. Finally, Australian CPI (inflation) data came in higher than expected, showing an annualized rate of 5.6%, when only 5.3% was expected.
Last week’s other key data releases were:
- UK Claimant Count Change – this was worse than expected, which is bad news for the faltering UK economy.
- US Unemployment Claims – this came in as expected.
- US, German, UK, French PMI Flash Manufacturing & Services data – this mostly was slightly better than expected.
- US Revised UoM Consumer Sentiment – this was slightly better than expected.
- German ifo Business Climate – this was a bit better than expected.
- Speech by Governor of RBA – nothing of importance was said.
The Week Ahead: 30th October – 3rd November
The coming week in the markets is likely to see a higher level of volatility to last week, as there will be a much larger number of important economic data releases, especially the FOMC meeting which will determine the US Fed’s interest rate, as well as two other policy meetings at major central banks. This week’s key data releases are, in order of importance:
- US Federal Funds Rate and FOMC Statement
- US Non-Farm Payrolls and Hourly Earnings
- Bank of Japan Policy Rate, Monetary Policy Statement, and Outlook Report
- Bank of England Official Bank Rate, Votes, and Monetary Policy Summary
- US JOLTS Job Openings
- German Preliminary CPI (inflation) data
- Swiss CPI (inflation)
- Spanish Flash CPI (inflation)
- Chinese Manufacturing PMI
- Canadian GDP
- US ISM Services PMI
- US Employment Cost Index
- US CB Consumer Confidence
- US ISM Manufacturing PMI
- US Unemployment Claims
- Canadian Unemployment
- New Zealand Unemployment Rate
Technical Analysis
US Dollar Index
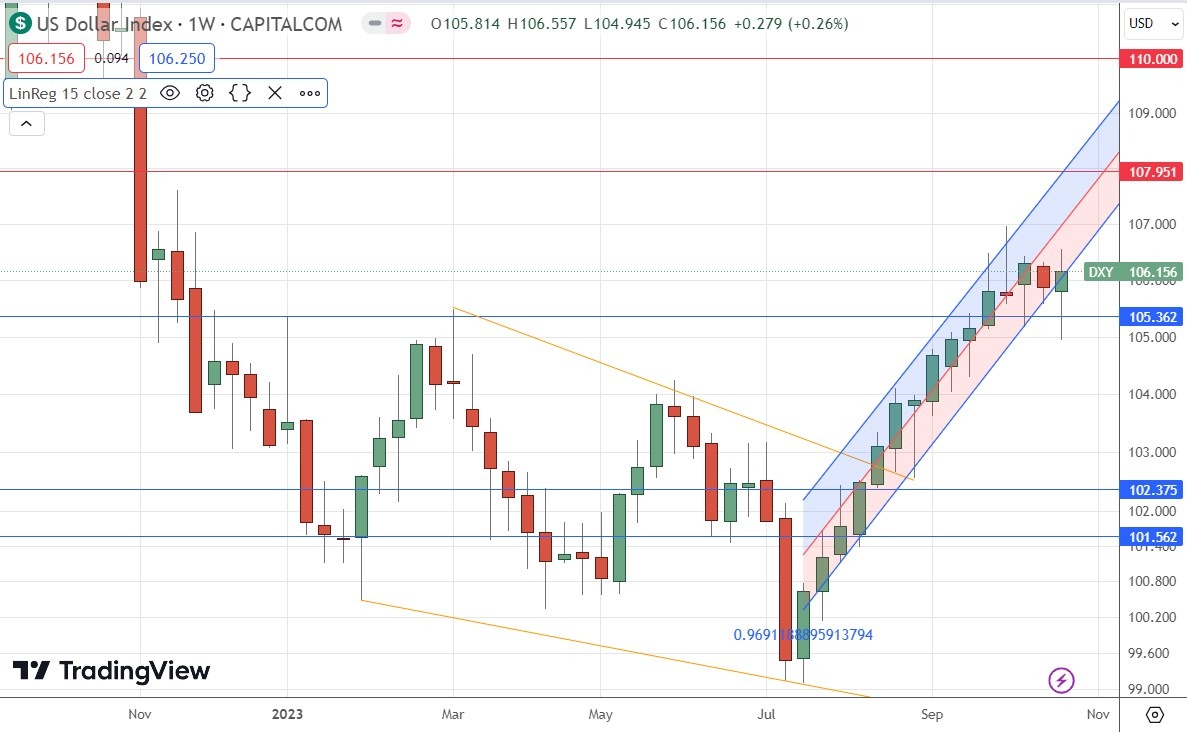
The US Dollar Index printed a weakly bullish outside bar last week, after making its highest weekly close in 11 months two weeks previously. Although the week ended higher, it was not the highest recent weekly close, and the candlestick’s real body was not able to engulf that of the previous week’s candlestick. So, we have weakly bullish signs only, although the fact that the price again rejected the support level at 105.36 is a further bullish sign.
The price has been rising for more than three months every week except for three weeks within this period, as shown by the linear regression analysis channel which I have added to the price chart below.
I would only look to take trades in the Forex market which are long of the US Dollar over the coming week, due to the valid and continuing long-term bullish trend in the greenback.
USD/JPY
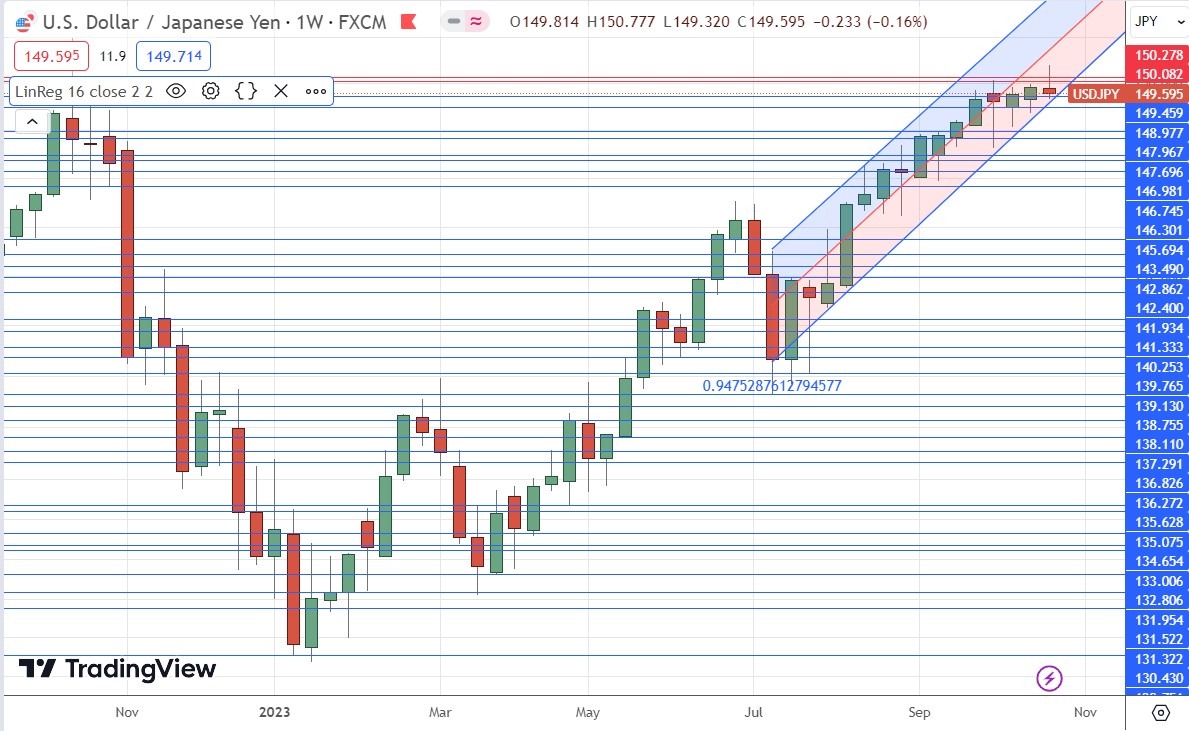
The USD/JPY currency pair printed a bearish pin bar over the week, after trading for a day or so above the big round number at ¥150 while also making a daily close above it. This number is clearly a major barrier and is being defended, as evidenced by the declining volatility as the price got closer and closer to it. It is likely to be a very pivotal point and it seems likely that the Bank of Japan intervened to buy the Yen when it was above ¥150.
I still see this currency pair as a long-term buy due to the very loose monetary policy of the Bank of Japan, as well the long-term downwards trend in the Japanese Yen. However, it cannot be denied that the Bank of Japan and other major market actors might be able to successfully defend ¥150.
The US Dollar is also relatively strong, and I think will be boosted even more if the war in the middle east widens this week, which markets are seeming to discount, so I see the chance for a surprise as to the upside.
I would enter a new long trade in this currency pair only after a firmly bullish daily close above ¥150.50.
GBP/USD
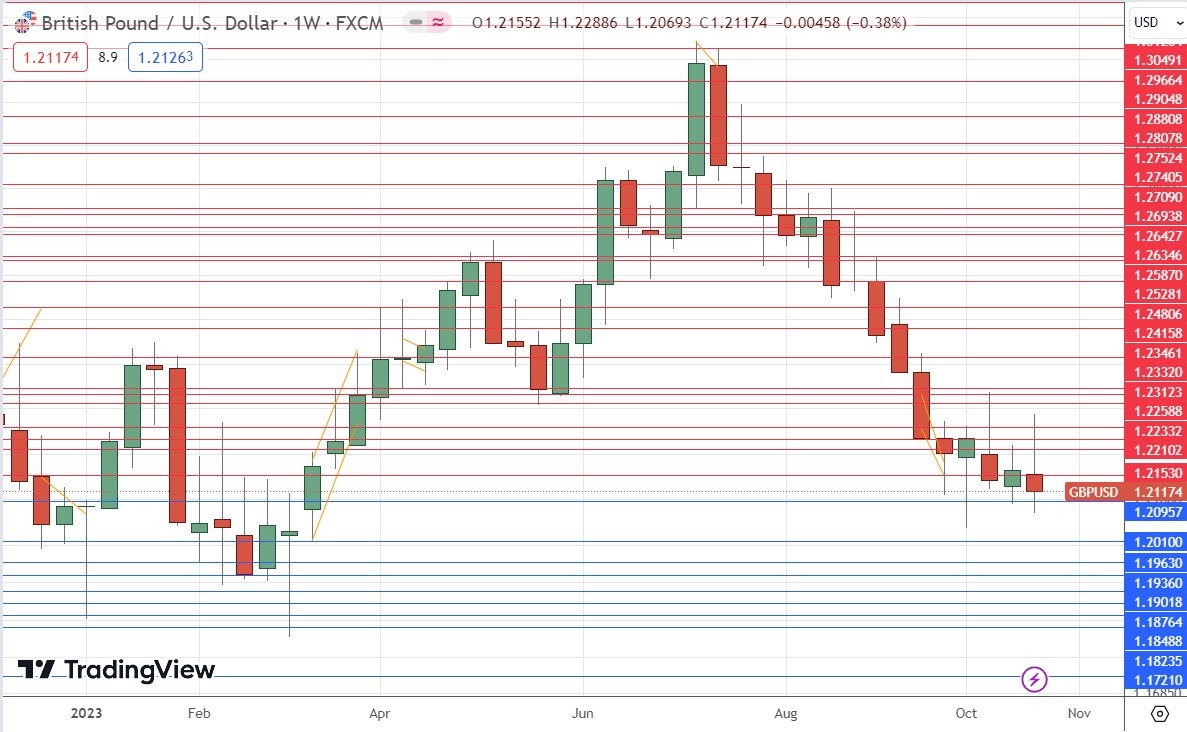
The GBP/USD currency pair declined last week, printing a bearish pin bar which made the lowest weekly close seen in 7 months. The price closed quite near the low of the week’s range. These are bearish signs. However, it is worth noting that the resistance levels above the big round number at $1.2000 remain intact, and that the momentum of this bearish trend has slowed down in recent weeks.
The British Pound is a relatively weak major currency, due mainly to the poorly performing UK economy and its persistently high inflation.
I will be prepared to enter a new short trade in this currency pair if we get a daily close below $1.2000 one day this week.
NZD/USD
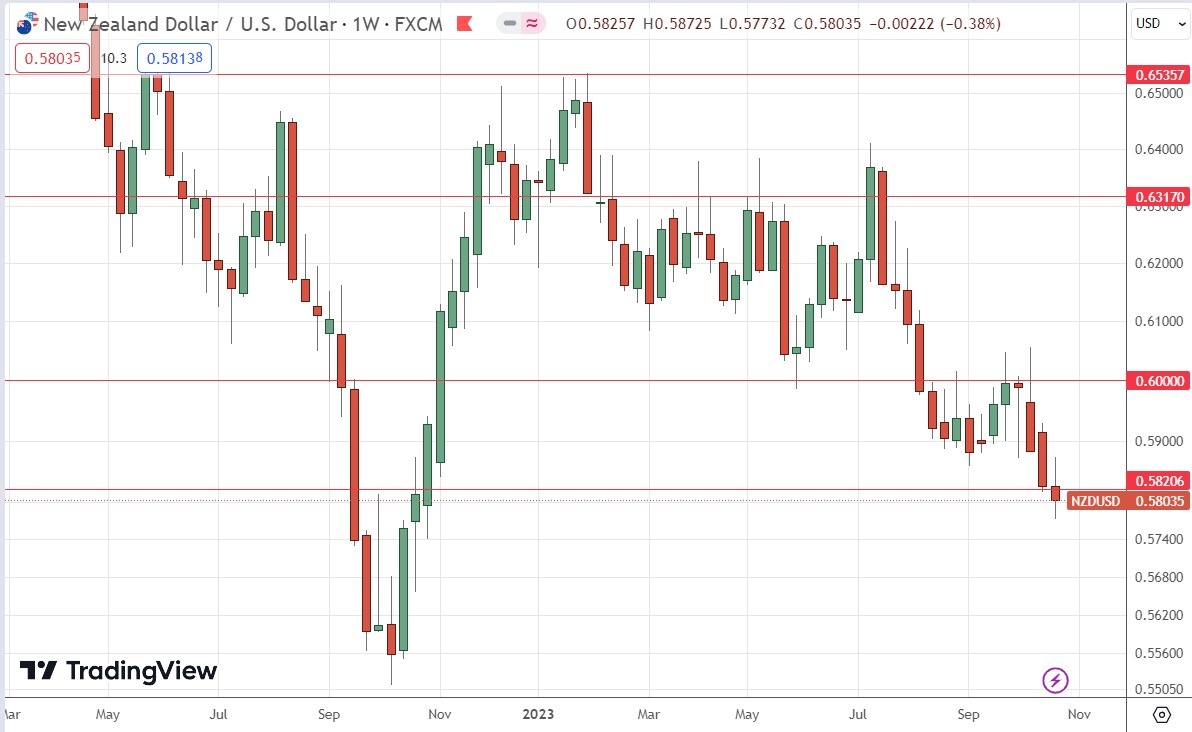
The NZD/USD currency pair declined last week, printing bearish candlestick which made the lowest weekly close seen in over one year. This is a bearish sign, as is the price closing below the former support level at $0.5800.
There has been a long-term bearish trend in the Kiwi since the start of 2023, although it has been a slow and choppy trend, as can be seen in the weekly price chart below.
The Kiwi is notably weak, similar to the Australian Dollar, but even weaker. This is partly due to risk-off sentiment in the market, but also due to the strong economic downturn taking place in China, as China is a major trading partner of New Zealand.
This currency pair does not trend reliably, so it may be best approached by day trading but looking only for short trades.
Gold
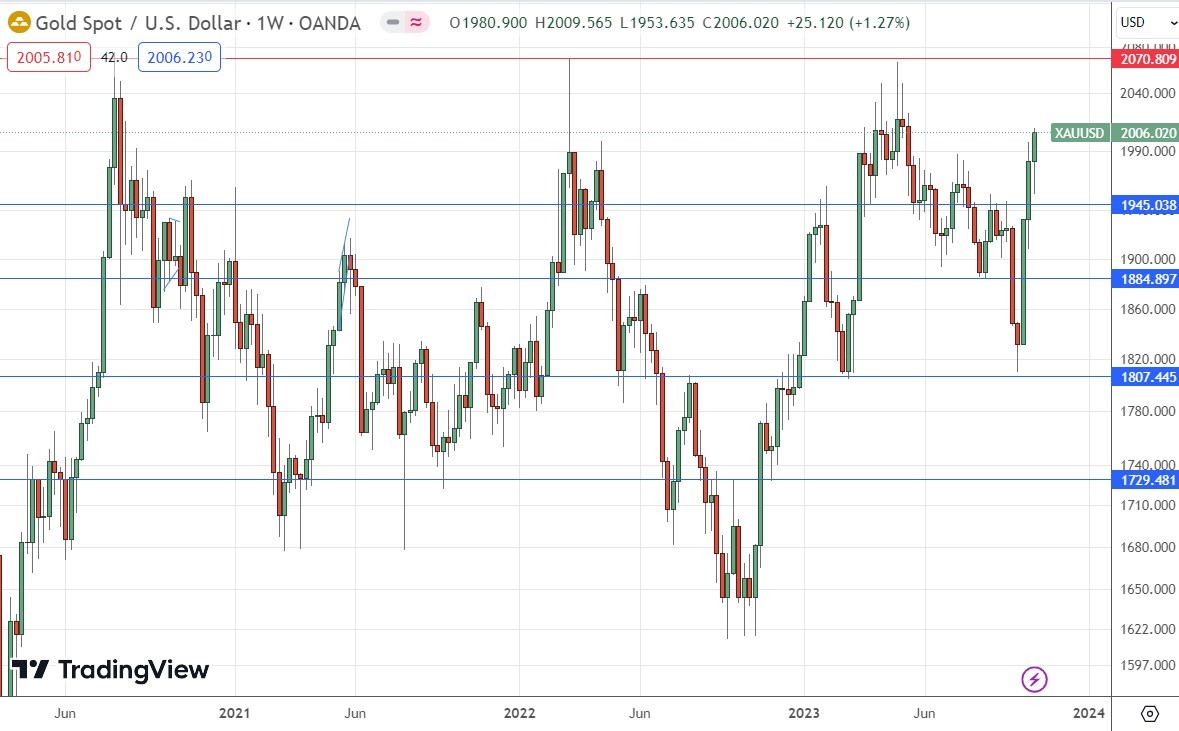
Gold was yet again the standout market gainer of last week, after trading at long-term lows very close to an area of support confluent with the round number at $1800 only four weeks ago.
If you look at the price chart below, you can see how strong and impulsively bullish the past three weeks have been, as the rise cuts quite easily through a long-term area where the price has spent a lot of time within.
The price rose firmly, and after reaching its highest level since May earlier this year, pulled back a bit. However, it still made its highest weekly close in 5 months.
Another reason why the rise in Gold is notable is that stock markets, with which Gold is usually highly positively correlated, ended last week firmly lower, so it seems that Gold is acting as a safe haven and a hedge against the middle east war widening. I think the markets are underestimating the chance of the war widening, so Gold could be a good hedge against that.
The problem with going long of Gold now is that the move feels very over-extended. A key metric used to measure trends by hedge funds, the 50-day and 100-day simple moving average crossover, has not yet happened to the bullish side in Gold.
Gold ended the week above $2,000 which has been a crucial area of resistance, but a look at the long-term price chart below shows that the three times since 2020 that Gold has got near its all-time high price at $2,070 it tends to begin a new bearish trend.
As a trend trader I would consider going long of Gold but only once the moving averages are aligned correctly. Otherwise, if the price touches $2,070 and makes a strong bearish reversal, a short trade could look like an exciting opportunity.
NASDAQ 100 Index
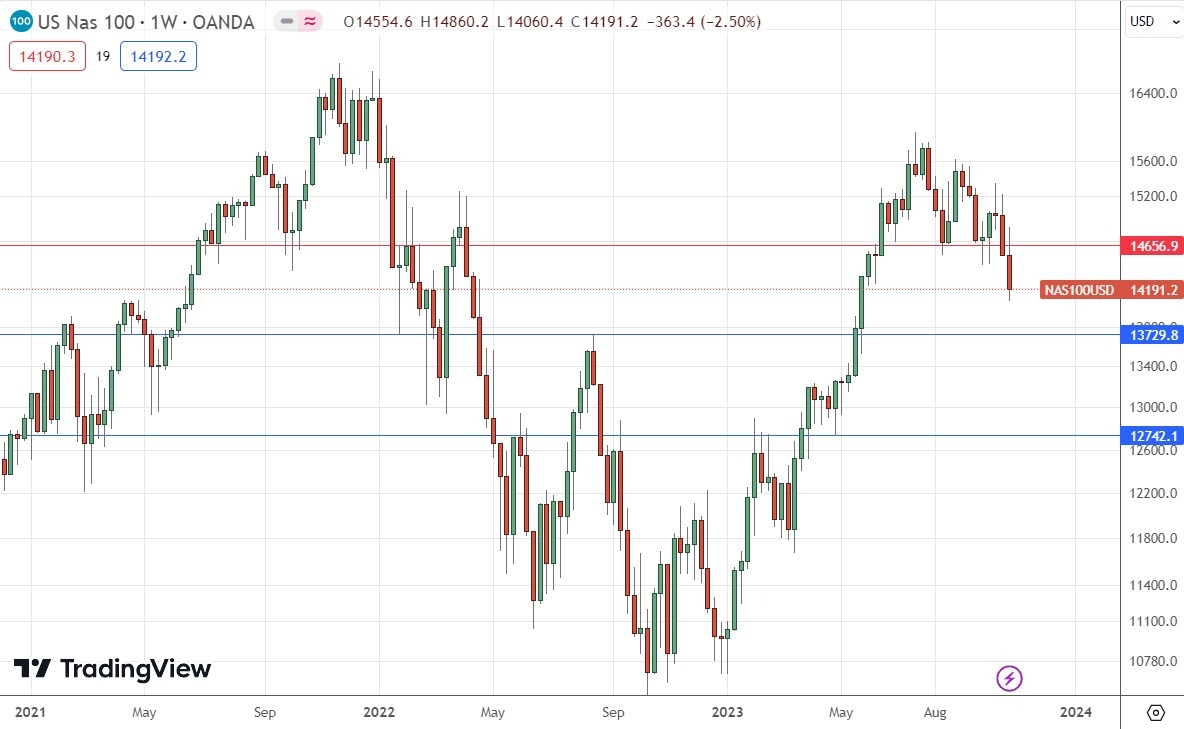
The NASDAQ 100 Index printed a bearish candlestick, which made the lowest weekly close in 5 months. On a daily price chart, it can be seen that the 50-day moving average is not far from crossing below the 200-day moving average, which is typically seen as the sign of the start of a bear market.
Stocks are performing poorly globally.
There is bearish momentum here, but keep in mind that shorting major stock markets is a dangerous endeavor, especially for trading beginners.
Cocoa Futures
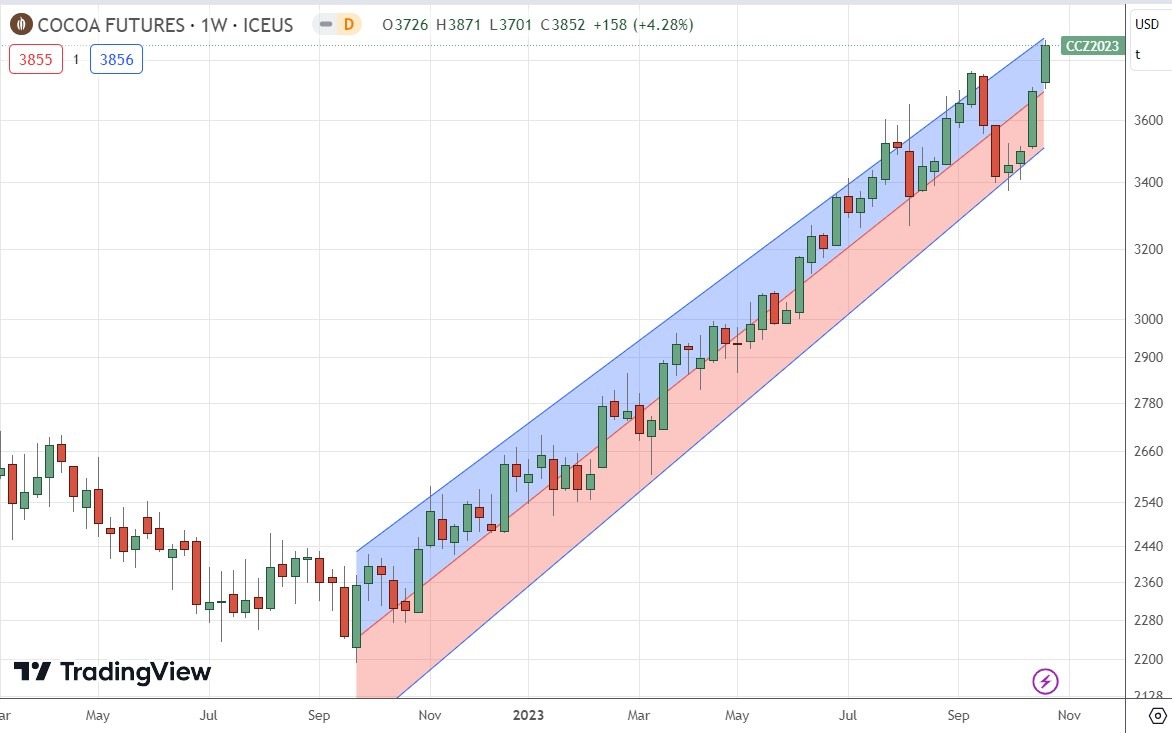
Cocoa futures have been in a strong bullish trend for over a year now. The price chart below applies a linear regression analysis to the past year and shows graphically what a great opportunity this has been on the long side.
It is always a bit aggressive to enter without a pullback, but this is a strong trend that shows no sign of stopping on ever-increasing global demand for the superfood cocoa.
Trading commodities long on breakouts to new 6-month highs has been a very profitable strategy over recent years.
Bottom Line
I see the best trading opportunities this week as:
- Long of the USD/JPY currency pair following a strongly bullish daily close above ¥150.
- Long of Gold following a new strongly bullish daily close above $2,070.
- Short of GBP/USD following a daily close below $1.2000.
- Long of Cocoa futures.
Ready to trade our Forex weekly forecast? Here’s a list of some of the best Forex trading platforms to check out.
