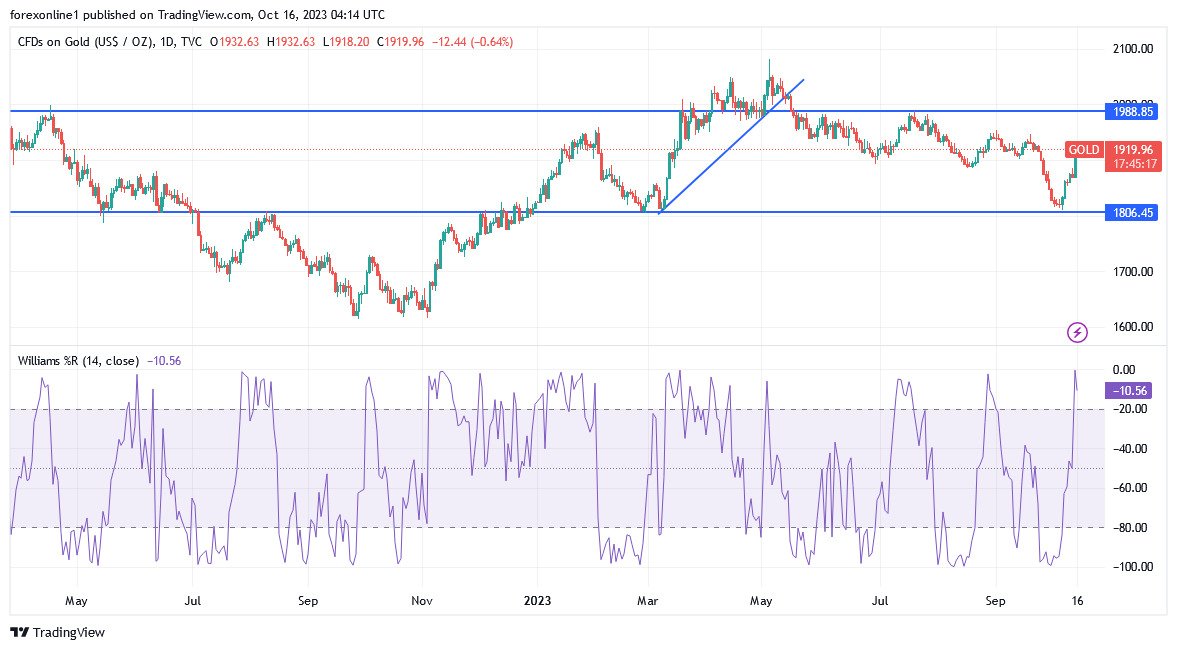
By the end of last week's trading, gold prices rose to their highest levels in three weeks, affected by the escalating situation between Hamas and Israel. Therefore, investors are looking for refuge in gold and other safe haven assets.
Top Regulated Brokers
- In last Friday's session, the price of gold saw its best daily performance in months, and as a result, gold prices achieved weekly gains of approximately 5%, in addition to their annual increase, which amounted to about 6% since the beginning of the year 2023
- In the same performance, silver, the sister commodity to gold, appeared to end an exciting trading week.
- Silver prices rose to the threshold of resistance at $23 per ounce.
- In general, the white metal recorded a weekly jump of 5%, but it is still down by 5.5% on an annual basis.
Bond Yealds to Be Closely Watched
On the Middle East front, the Israeli military has asked more than a million Palestinians to evacuate northern Gaza, indicating that Israel may soon launch a ground invasion against the Iranian-backed Hamas movement. This has led to a renewal of Fair Trade ahead of the weekend.
After falling to a 2023 low of $1,823, gold futures rose after the October 7 attacks.
At the same time, gold prices found support against the backdrop of the weakness of the US dollar, as the US Dollar Index (DXY), a measure of the dollar against a basket of major currencies, stabilized at approximately 106.60. The index rose by 0.6% last week and has risen by 3% since the beginning of 2023. As is known, the performance of the dollar affects the price of gold because it can determine the quantity that foreign investors can buy.
Another factor affecting the gold market is bond yields. US Treasury yields were mostly lower, with the 10-year bond yield falling 7.4 basis points to 4.637%. The yield on two-year bonds fell by 1.5 basis points to 5.056%, while the yield on 30-year bonds fell by 8.4 basis points to 4.787%. Fluctuations in interest rates can affect the opportunity cost of holding non-yielding bullion.
Meanwhile, there was a lot of economic data on Friday. The US Consumer Confidence Index issued by the University of Michigan fell to a reading of 63 in October, down from a reading of 68.1 in September and well below market estimates of 67.2. One- and five-year inflation expectations rose to 3.8% and 3%, respectively. US import prices rose less than expected by 0.1%, while US export prices rose at a higher than expected rate of 0.7%.
As for other metal markets, copper futures fell to $3,571 per pound. Platinum futures fell to $883.50 an ounce. Palladium futures fell to $1,146.00 an ounce.
Technical analysis of gold prices:
The XAU/USD gold price is now trading several levels above the 100 hour moving average line. The price of the yellow metal also rose to the overbought levels of the 14-hour Relative Strength Index. In the near term, and according to the performance on the hourly chart, it appears that the XAU/USD pair has recently completed an upward breakout from the bullish channel formation. This indicates a significant increase in bullish sentiment in the market. Therefore, the bulls will look to extend current gains towards $1,938 or higher to $1,945. On the other hand, the bears will be looking to pounce on pullbacks around $1,907 or lower at $1,899.
In the long term, and according to the performance on the daily chart, it appears that the price of gold is trading within an ascending channel. This indicates a significant long-term upward bias in market sentiment. Therefore, the bulls will target long-term profits at around $1,958 or higher at $1,987 per ounce. On the other hand, the bears will look to pounce on pullbacks at around $1864 or lower at the $1812 support.

Ready to trade our Gold forecast? We’ve shortlisted the most trusted Gold brokers in the industry for you.
