


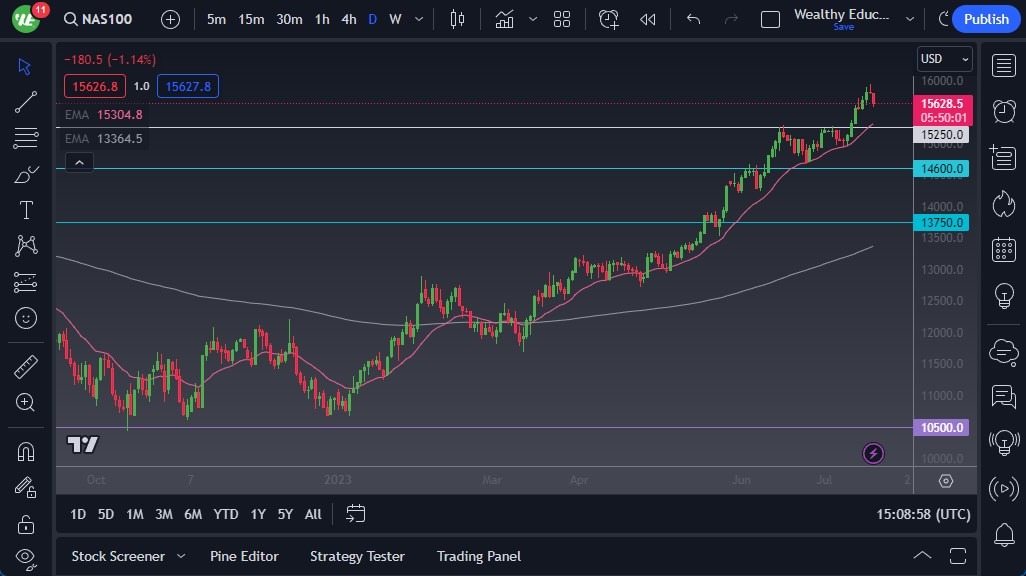
- The NASDAQ 100 has pulled back the trading session on Thursday, as we have seen gravity come back into the picture.
- After all, the market had gotten a little overstretched, with some questions about Tesla earnings and a few other larger companies such as Netflix, we will have to wait and see whether value Hunter’s returns.
- I do believe that continues to be the case though, because Wall Street has a certain “herd mentality” where everybody jumps into the same trade.
Top Regulated Brokers
Keep in mind that the NASDAQ 100 is highly sensitive to just a handful of stocks, as it is not an equal-weighted index. In other words, you must pay attention to all the usual technological standouts. The recent “AI narrative” has been a major driver of where the market is going, but ultimately, we must sooner or later see a significant amount of gravity come into the picture once we go much higher.
Waiting to See Some Type of Support
The 15,250-level underneath continues to offer a potential magnet for price, as it has been previous resistance and of course, we have the 50-Day EMA right around that area as well. All things being equal, this is a market that I think will see a lot of interest in that area, and therefore it will be interesting to see if we get some type of bounce from that area. In fact, I would be very interested in buying near that area, if we even get there.
It’s worth noting that the candlestick is rather long, and it’s probably worth noting that the candlestick from the previous session was a bit of a shooting star, showing that the 16,000 level above is going to be an interesting barrier. Ultimately, this is a market that’s been in an uptrend for quite some time, and I do think that it comes back to the upside, but a little bit of a pullback should be thought of as a potential buying opportunity. I don’t necessarily think that you should just jump in right away and start buying, but I am waiting to see some type of support, especially in the daily chart to start going long. If we break down below the 15,250 level, then it’s possible that we test the psychologically important 15,000 level.
 Ready to trade the NASDAQ 100? We’ve shortlisted the best Forex brokers for CFD trading in the industry for you.