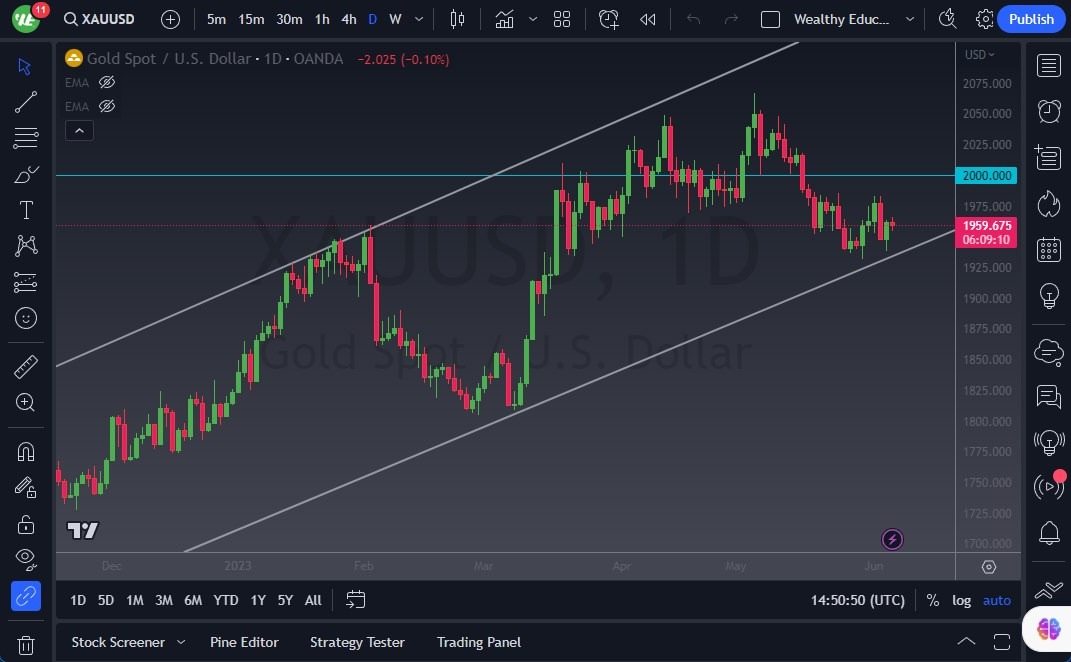
- The gold market displayed mixed price action during Tuesday's trading session, as it oscillated near the 50-Day Exponential Moving Average (EMA).
- The 50-Day EMA is a widely observed indicator that currently appears flat, reflecting the lackluster nature of this market.
- Presently, the market seems to be consolidating as it seeks to find signs of renewed strength and potential recovery.
Top Regulated Brokers
Upon examining the chart, we can observe that the $1960 level has acted as a support level, while the $2000 level above represents a significant resistance barrier. If the market manages to break above the $2000 level, it could potentially target the $2050 level. Conversely, a breakdown below the $1960 level may lead to a decline toward the 61.8% Fibonacci level, around the $1920 level. It is important to note that between the 50-Day EMA and the 200-Day EMA, there tends to be a significant amount of noise, which can result in volatile market behavior.
In the long run, I anticipate the gold market to move higher. However, this expectation is contingent upon a reduction in yields in the bond markets. Typically, when bond markets offer attractive returns, investors may opt for bonds over gold, which is considered a safer asset. However, if bond yields begin to decline, a negative correlation could come into play, potentially fueling a rally in the gold market. I do believe this will eventually be a possible outcome. However, I wouldn’t get aggressive until the markets are obviously moving in the proper direction.
Be Patient
In the meantime, the market is likely to continue its back-and-forth movement within this range as it seeks direction. Although it appears that the market is gradually building momentum to move higher, it is important to wait for a clear signal from the market before initiating long positions in gold. In the interim, exercising patience is likely to be a prudent approach.
At the end of the day, the gold market demonstrated a mixed performance, hovering around the 50-Day EMA. Key levels to monitor include the $1960 support and the $2000 resistance. A break above resistance or below support could pave the way for further market movements. Ultimately, a reduction in bond yields could provide the impetus for gold to rally. However, it is essential to await confirmation from the market before making any buying decisions. Practicing patience and closely observing market dynamics will be crucial during this period.

Ready to trade our Gold price forecast? We’ve made a list of the best Gold trading platforms worth trading with.
