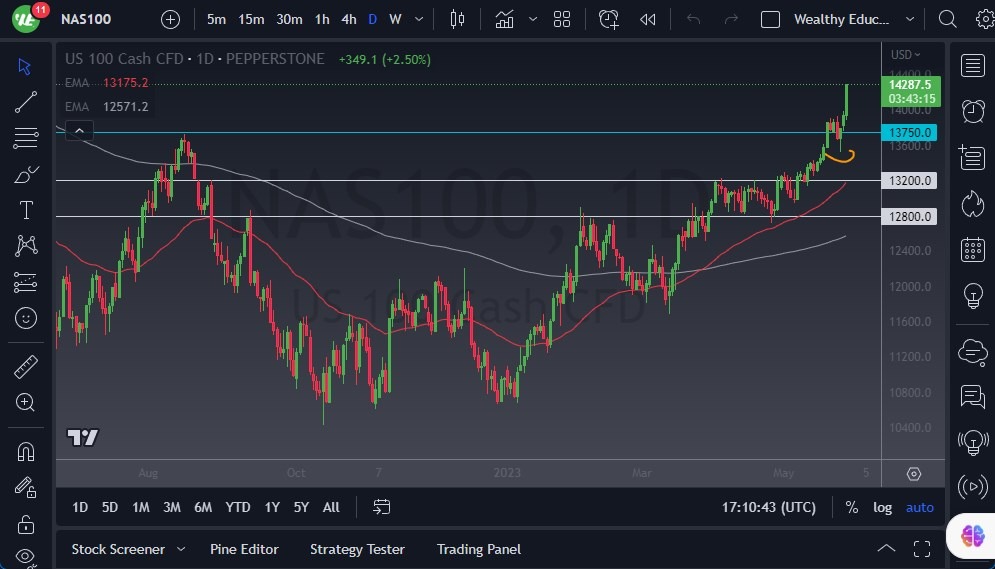
- The NASDAQ 100 shot straight up in the air on Friday, as we have now broken above the psychologically important 14,000 level.
- Because of this, it looks like we have a scenario where the “FOMO trade” has taken the market by storm.
- With this being the case, I think the NASDAQ 100 probably continues to go much higher, as we have finally seen a lot of resistance broken above.
As I write this article, we are threatening a major area of resistance yet again, and considering that we have gotten there in the blink of an eye, and as I write this it’s only the Americans left, it does make a lot of sense that Wall Street will push this market much harder, and send it to the upside over the next couple of sessions. The market is more likely than not going to continue to be a “buy on the dips” type of situation, because it’s obvious that the momentum is all in one direction.
Looking at this chart, I think that the 13,750 level is a “hard floor in the market”, assuming that we can get anywhere near there. I would be surprised to see us break back below the 14,000 level anytime soon, and I would look at that area as a potential area to pick up a bit of value in a market that simply seems to be running away.
Looking for a Pullback
One thing to be concerned about is that after a move like this, there is almost always a significant amount of selling pressure given enough time, as traders will continue to look at this through the prism of whether or not it is overbought. Sooner or later, you will have to have some type of profit-taking, and it’s in that environment, you will probably find your next opportunity. With that, I am looking for a pullback to take advantage of and would not chase the NASDAQ 100 all the way up here. Granted, it’s difficult to want the to market continue to go higher and sit on your hands, but that might be what you have to do.
A short-term pullback at this point in time does offer opportunities and I think we are heading toward the 14,500 level in the short term, and perhaps 15,000 over the longer term.
Potential signal: buying the NASDAQ 100 is the only thing you can do at the moment. I think any pullback near the 14,000 level is now a buying opportunity, with a stop loss at 13,750. At that point, I would target the 14,500 level, and perhaps even add on a break above that level to go looking toward the 15,000 level.

Ready to trade our daily Forex signals? Here’s a list of some of the top 10 forex brokers in the world to check out.
