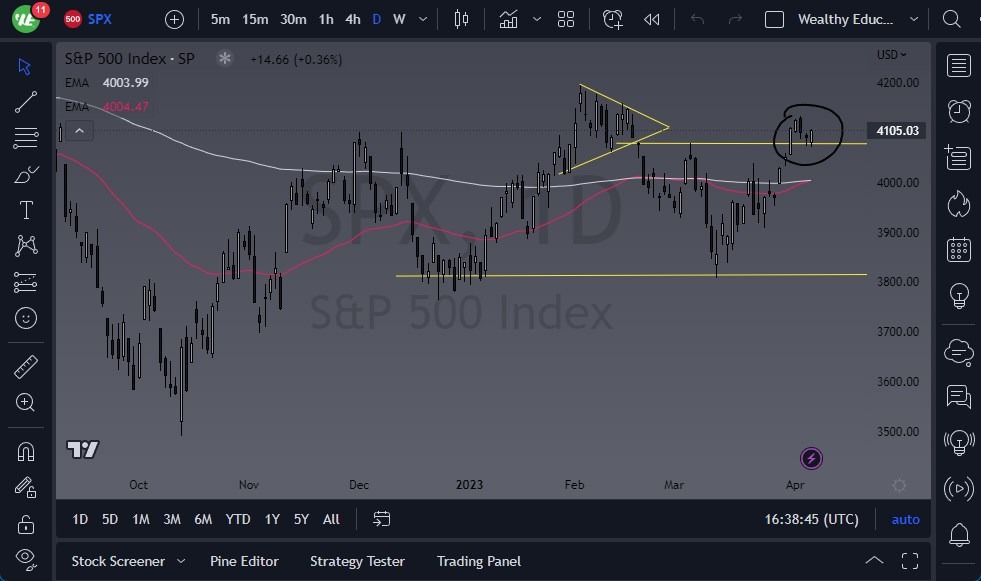
The S&P 500 was closed on Friday, but looking at the action over the past week, there are a few things that we can gather from the charts. One bullish sign is the possibility of a bullish flag, which could potentially open up the possibility of a move to the 4300 level. However, there are also some concerns to keep in mind. The market has been trading in a range between the 4100 level and the 4200 level, which suggests that we may continue to see a lot of short-term or erratic behavior.
On the longer-term chart, the 4200 level is a major resistance barrier, with the 3900 level being a major support level. This suggests that we are in a consolidation area that longer-term traders will continue to keep an eye on. The 50-Day EMA has broken above the 200-Day EMA, which shows some bullish pressure, but both moving averages have been relatively flat up to this point.
Ultimately, the market is likely to continue seeing a lot of noisy behavior, which means that investors will need to keep their position size relatively small. However, if we do break down below the 4100 level, then we could see a significant fall. On the other hand, if we break above the 4200 level, then there's a good chance that the S&P 500 could go much higher, with a potential target of the 4300 level.
While there are certainly some risks to consider, such as the softening economic numbers in the US, the market may not necessarily be starting to get away from the liquidity equation. It's important for investors to stay informed about market trends and to keep an eye on key support and resistance levels.
The S&P 500 is likely to continue experiencing a lot of short-term or erratic behavior. However, there are some signs of bullish pressure, and if we break above the 4200 level, we could see a significant rally. Investors should keep their position size small and stay informed about market trends to make informed trading decisions. The future of the S&P 500 will depend on a variety of factors, including economic indicators, geopolitical tensions, and global events. After all, there are plenty of moving pieces out there that could cause volatility. The markets will continue to be choppy.
Ready to trade the S&P 500 Forex? We’ve shortlisted the best Forex brokers for CFD trading in the industry for you.