


- On Tuesday, the S&P 500 Index started off with an attempt to rally, but eventually showed signs of exhaustion, indicating that the market could be reaching its peak.
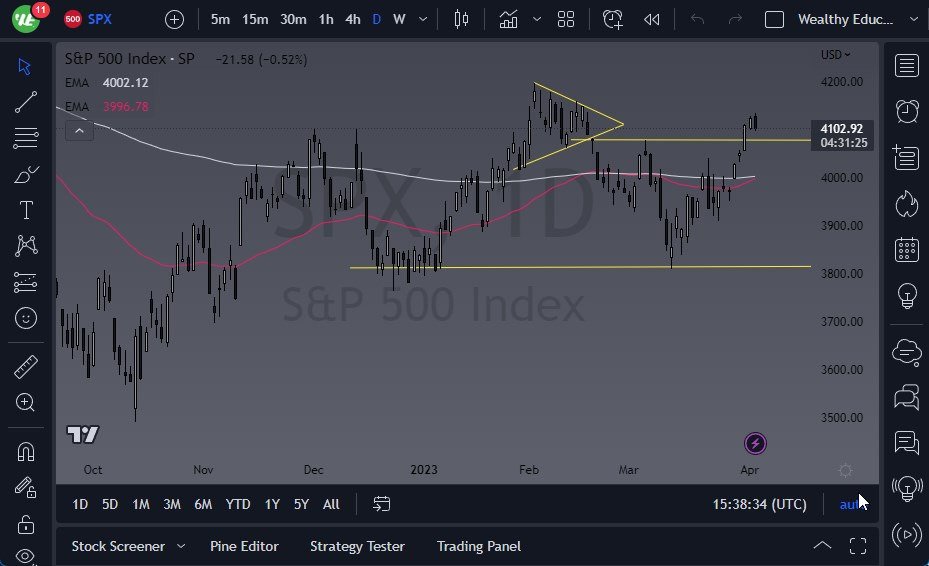
- As we approach the 4200 level, which is the top of the previous massive block of resistance, the market is likely to face a lot of noise above.
- If the index breaks above the 4200 level, it would be a significant bullish trend and could indicate that the market will continue to go much higher.
The S&P 500 Is Overbought
However, a pullback in the market makes sense at this point, as it could reach down to the 4100 level, which was the previous support level for the trading area that we are currently in. A pullback is also expected because the market has seen a massive upward movement, and momentum studies indicate that it is overbought. If the S&P 500 breaks down below the 4100 level, it may go looking toward the moving averages, which are currently sitting just above the 4000 level.
The 50-Day EMA and the 200-Day EMA are going sideways, and hence it is likely that we will continue to see that area as potential support, which could be a target for those who prefer playing the reversion to the mean type of systems. Although a major selloff is not expected, a pullback is likely, and it would be healthy for the market, even for those who are bullish.
In addition to the technical factors, there are also several fundamental factors that are influencing the market. For instance, the ongoing COVID-19 pandemic and the global vaccine rollout have been affecting the market significantly. Economic data and earnings reports are also important drivers of the market.
Moreover, the Federal Reserve's monetary policy is another crucial factor that could influence the market's direction. The Fed is keeping interest rates low to support the economic recovery, and it is also continuing to buy bonds, injecting liquidity into the market. The Fed's decision on its monetary policy will have a significant impact on the market, and investors are keeping a close eye on the central bank's moves.
In summary, while the S&P 500 started off with an attempt to rally on Tuesday, it eventually showed signs of exhaustion, and a pullback in the market is likely. Although a major selloff is not expected, a pullback would be healthy for the market. Investors should keep an eye on both the technical and fundamental factors that could impact the market's direction.
Ready to trade the S&P 500 Forex? We’ve shortlisted the best Forex brokers for CFD trading in the industry for you.