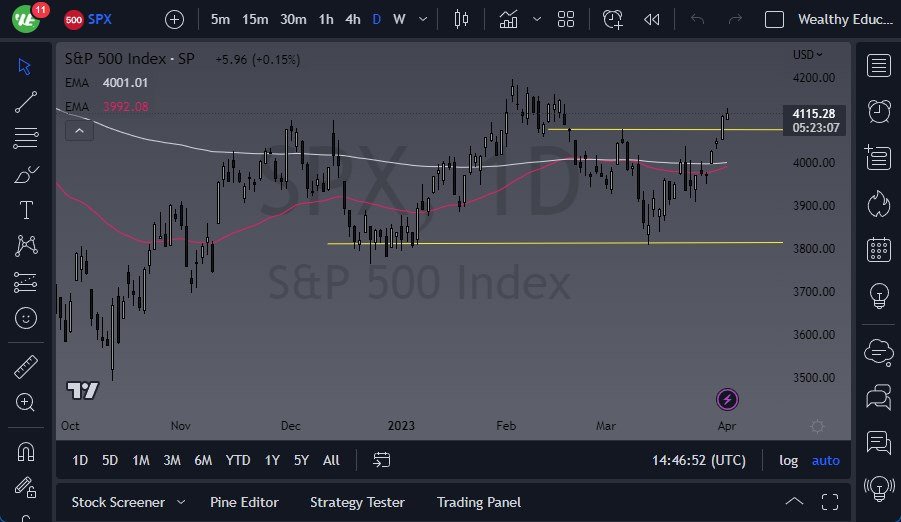
- The S&P 500 Index has been in a period of consolidation recently, and it looks like it may continue to be that way for the near future.
- During Monday's trading session, the market was relatively flat, which indicates that it may be a bit stretched at this point.
- However, Friday's job numbers could change everything, and this week may be a bit strange for traders.
Selling Pressure Ahead
If we break back below the 4100 level, we could see the market drop towards the 4000 level, where the 50-Day EMA and the 200-Day EMA indicators are currently sitting. These indicators are flat, and while the 50-Day EMA is showing signs of life, they may still serve as a target if we see a breakdown.
On the other hand, if the market takes off to the upside, the 4200 level could be an area of interest, as it had previously been resistance. If we break above that level, it would be a very bullish sign. However, if we see signs of exhaustion between here and there, it could signal that the market is ready to roll over again. In that case, it would make sense to see a pullback.
If we do get a breakout to the upside, the S&P 500 could reach towards the 4300 level rather quickly. Additionally, if we were to break above the 4200 level, it would be a huge breach to the upside after what had been a very ugly market. This could be a sign that we are in the longer-term bullish trend.
This week, traders will be closely watching the job numbers on Friday. If they are better than expected, we may see a bullish move. However, if they disappoint, we could see the market drop. Additionally, Good Friday is a holiday, so the market will be closed, which could make for a volatile week as traders react to the news.
Overall, it's important to be cautious and patient during times of consolidation. While there may be opportunities for gains, there are also risks of losses. As always, it's important to have a solid investment strategy in place and to stick to it. That being said, now that the ISM Manufacturing PMI numbers came out lower than anticipated, traders will also have to factor in the idea that we may be looking at a recession much quicker than anticipated. Overall, this is a situation where being cautious with your position size makes quite a bit of sense, but it’s likely that we are going to run into a lot of selling pressure just above.

Ready to trade our S&P 500 analysis? Here’s a list of some of the best CFD brokers to check out.
