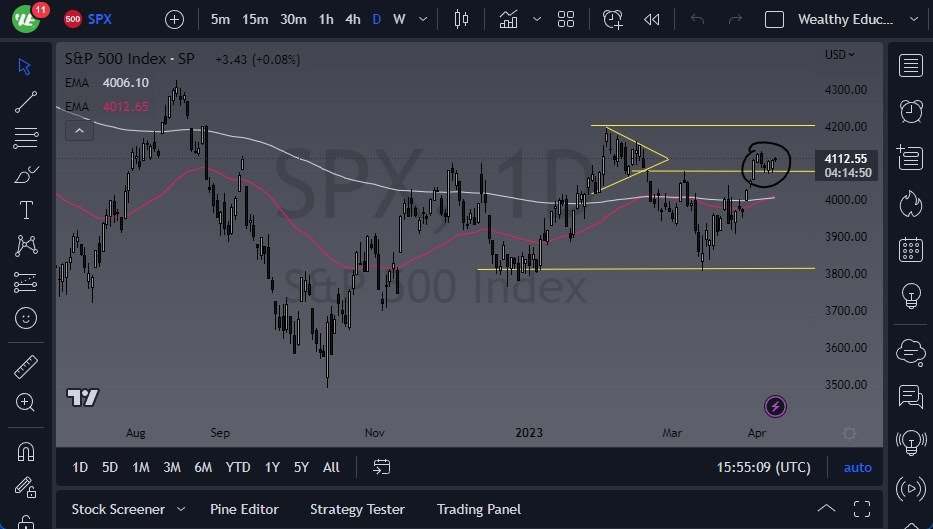
The S&P 500 Index has been experiencing a lot of volatility as investors try to figure out the next move. The resistance level is currently sitting just above the 4200 level, and with credit default swaps at all-time highs against most US banks, this could be a negative sign for the stock market. It is likely that we will see the S&P 500 struggle as the banks continue to be a problem. If this continues to see that level as a many barrier, this could set up the next pullback.
Heading Into the Earnings Season
Furthermore, earnings season is approaching, and corporations will have to report their reality, which could lead to a significant move in the market. If the numbers are not good, and the forward guidance is poor, it could result in the legs being kicked out from underneath the table that has been keeping the market elevated. The market has been extremely bullish, but this may not be sustainable in the long run.
If there is a pullback, the 4100 level will offer a significant amount of support, along with the 4000 level, which is a psychologically significant figure. These levels are where the 50-Day EMA and 200-Day EMA indicators are hanging around. On the other hand, breaking above the 4200 level would be extremely bullish, although this could be difficult to achieve. If we do, then it becomes a new game altogether.
- Investors need to follow what the market is doing, not what it "should do."
- It is important to be cautious and not jump into any trades too quickly.
- Volatility is to be expected in the stock market, and investors need to be prepared for any outcome.
In conclusion, the S&P 500 is experiencing a lot of noise and volatility, and it is difficult to predict what will happen next. It is important to pay attention to resistance and support levels and to be cautious when investing. With earnings season approaching, it is crucial to keep an eye on corporate reports and forward guidance. Ultimately, the key is to be patient and wait for the market to show its hand before making any major moves. After all, there are a lot of concerns around the world, and this isn’t going anywhere anytime soon.

Ready to trade our S&P 500 analysis? Here’s a list of some of the best CFD trading brokers to check out.
