


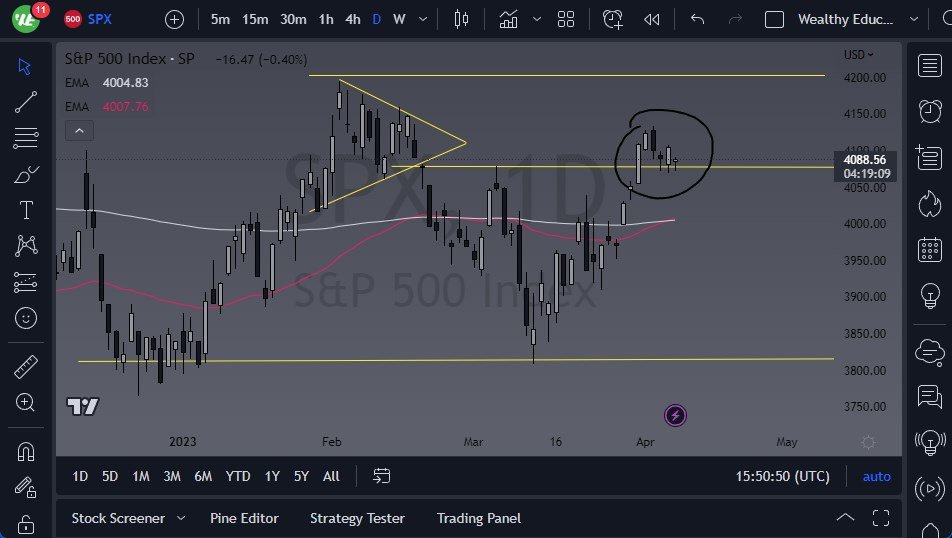
- The S&P 500 Index took a major hit during Monday’s trading session, falling to the 4100 level and demonstrating signs of weakness from the start.
- The market has fallen drastically, and with earnings season on the horizon, we are likely to see even more negative results.
- As a result, it is entirely possible that we could drop to the bottom of the overall consolidation area, which is as low as the 3900 level.
Selling in the Near Term
On the upside, the 4200 level poses a major resistance barrier, and it is unlikely that the market will take off unless there is a significant change in earnings season or the Federal Reserve's policy. Currently, the Federal Reserve seems set on providing free and cheap money to Wall Street banks, which could be a driving force in the market's future.
However, the moving averages sitting above the 4000 level continue to be a major issue, as it is essentially "fair value" in the trading range. Therefore, rallies will likely be sold into until there is a significant breakthrough.
While volatility has been a major issue, it seems likely that the top of the overall range has been reached, and a pullback may be necessary. It is challenging to see a scenario where we suddenly take off to the upside, but anything is possible.
Ultimately, the market has a lot of moving pieces, making it challenging to make predictions with absolute certainty. The S&P 500 will likely continue to go back and forth, trying to figure out the best course of action amidst all of these different factors.
If the market does break below the 4100 level, it could signal a larger pullback to come, with the 50-Day EMA indicator starting to rise. At the same time, if we break above the 4200 level, it could lead to a takeoff to the upside, and investors should be prepared for a potential market surge. Regardless, this is a time to be cautious and keep a close eye on the market's movements. However, as we are in the start of the earnings season, there will be a lot of attention paid to comments from CEOs in the US to gauge where the economic future is heading. The most likely of outlooks will be dark, so a certain amount of selling in the near-term would be expected.
Ready to trade our S&P 500 daily forecast? Here are the best CFD brokers to choose from.