


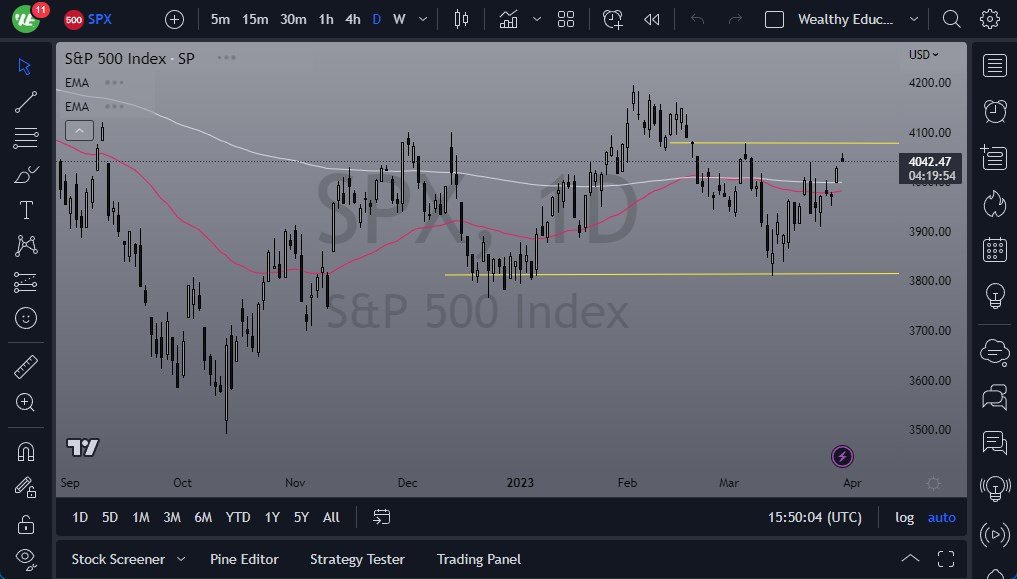
- The S&P 500 Index has been bullish to start Thursday, approaching the top of the trading range.
- However, there is a block of massive noise between 4140 and 4200, making it difficult to break out.
- Traders need to anticipate a potential pullback, with the market possibly dropping down to the 200-day EMA or even the 50-day EMA, which are conveniently sitting just above the psychologically important 4000 level.
- Anything below 4000 would have the possibility of dropping down to the crucial 3900 level, an area that has been massive support multiple times in the past.
All Eyes On Interest Rates
The S&P 500 will have to deal with questions regarding interest rates going forward. Although Wall Street is pushing for the Federal Reserve to cut rates and is celebrating the idea of lower interest rates, it actually works against the idea of the Fed easing rates and pushes asset prices higher. This is a game of chicken, and someone will have to give up eventually. Once that happens, there will likely be a big move, but it is too early to predict the direction.
Although technical traders may see the recent action as a potential "inverse head and shoulders," with all the noise just above, it is less enticing. The market does not have anywhere to be at the moment, and a pullback is likely. The 3900 level is a round number that a lot of people will be paying attention to, as it has been massive support multiple times in the past. If the market drops below that, the 3800 level will be challenged. Anything below the 3800 level is a very, very negative sign for the market.
At the end of the day, the S&P 500 has been bullish, approaching the top of the trading range. However, there is a block of massive noise between 4140 and 4200, making it difficult to break out. Traders should anticipate a potential pullback, with the market possibly dropping down to the 200-day EMA or the 50-day EMA, conveniently sitting just above the psychologically important 4000 level. The market will have to deal with questions regarding interest rates going forward, and once the game of chicken ends, there will likely be a big move. The 3900 level has been massive support multiple times in the past, and anything below that will challenge the 3800 level.
Ready to trade our S&P 500 daily forecast? Here are the best CFD brokers to choose from.