


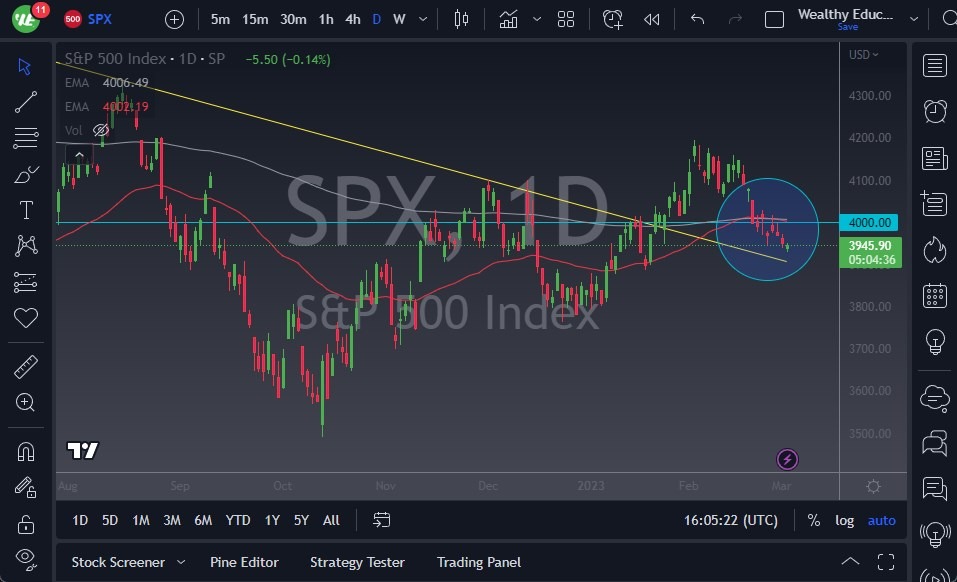
- The S&P 500 experienced a dip during Thursday's trading session, falling below the previous downtrend line that had been established at the top of the channel for some time.
- Although the market is expected to find some support at this level, it's unlikely that the S&P 500 will make a significant upside move.
- It's worth noting that the 4000 level is just above, and it's a large, round, and psychologically significant figure that could act as a significant barrier. Additionally, the 50-Day EMA and the 200-Day EMA indicators are just above this area, which further reinforces its significance.
In the short term, there may be rallies, but these are likely to encounter plenty of sellers above. As such, it may be more of a "fade the rally" type of market. However, it's important to keep in mind that this is a short-term situation, and if the market were to break above those moving averages, it could go up to the 4100 level, which had previously acted as support. Based on market memory, it would make sense for this area to now act as resistance.
Facing a Significant Resistance Level
On the other hand, if the market were to break down below the bottom of the hammer from Thursday's trading session, it would signal a move down to the 3900 level and possibly even down to the 3800 level. The latter is a large, round, psychologically significant figure that has attracted a lot of attention in the past, and we've seen a significant bounce from that level before.
However, anything below the 3800 level would be catastrophic, opening the possibility of another 200-point decline or more. While this is unlikely to happen easily, it's worth noting that the overall sentiment in the market is still negative and selling opportunities may arise on signs of exhaustion. It's important to be quick in and out of trades under such circumstances.
In conclusion, the S&P 500 is facing significant resistance at the 4000 level, with the 50-Day EMA and the 200-Day EMA indicators further adding to its importance. While there may be short-term rallies, these are likely to encounter selling pressure, and traders should be prepared to take advantage of selling opportunities on signs of exhaustion. Conversely, a break below the 3800 level could have severe consequences, making it essential to monitor the market closely in the coming days.
 Ready to trade our S&P 500 analysis? Here’s a list of some of the best CFD brokers to check out.