


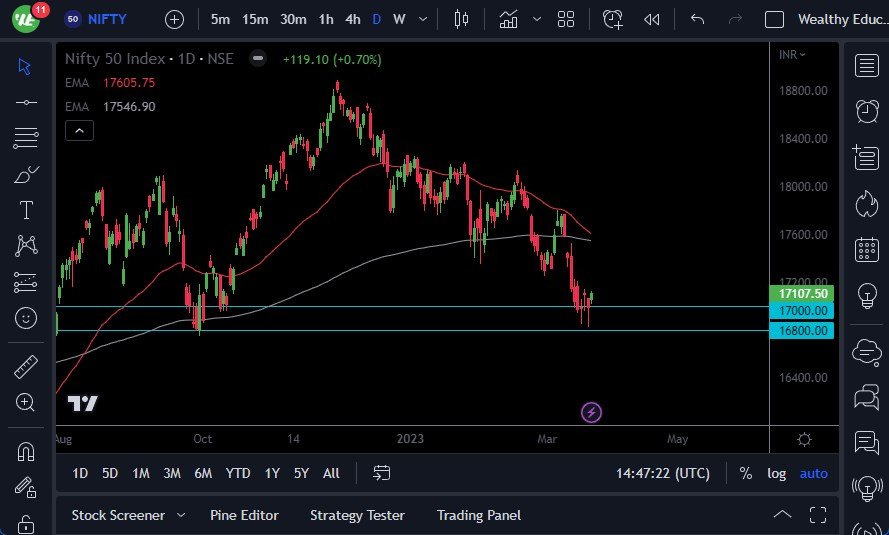
- The Nifty 50 in India has rallied ever so slightly during the trading session on Tuesday, as we are trying to form some type of bottom and then of course try to rally from a major support level that we previously had tested back in October 2022.
- The hammer that formed on Monday just confirmed the support that we had seen late last week as well.
- With that being the case, it looks like the ₹17,000 level is going to continue to be a situation where people look to pick up value.
- The support level at the ₹17,000 level extends down to the ₹16,800 level.
Technical Outlook Looks Negative
The 50-Day EMA is falling toward the 200-Day EMA, potentially kicking off a “death cross.” That being said, it’s generally a late signal that occurs, therefore I’m not overly concerned about it but it does tend to attract a lot of longer-term traders when this negative event happens. Regardless, if we can break above the ₹17,200 level, then it’s possible that we could go looking to the 200-Day EMA, which is closer to the ₹17,500 level. It’s possible that we could be trying to form some type of “V bottom”, which attracts a lot of inflow.
Keep in mind that India is very highly correlated to global growth, so it will come down to whether or not it seems like there is some type of relief for the global growth situation, or if we are going to continue to struggle. The market breaking down below the ₹16,800 level that opens up the possibility of a big drop, perhaps sending this market down to the ₹16,500 level, maybe even the ₹16,000 level.
If we do turn around and rally from here, it’s probably going to be more or less a grind higher than anything else. I would anticipate a lot of rocky behavior on the way up, but we could go as high as ₹18,000 if we pick up any type of momentum. If we can break above the ₹18,000 level, then it opens up the possibility of a move to the ₹18,800 level, where we had formed a bit of a top a while ago. Regardless, this is a market that you need to put little bits and pieces in at the same time, and then add if the market starts to work out in your favor.
Ready to trade the Nifty 50? Here are the best CFD brokers to choose from.