


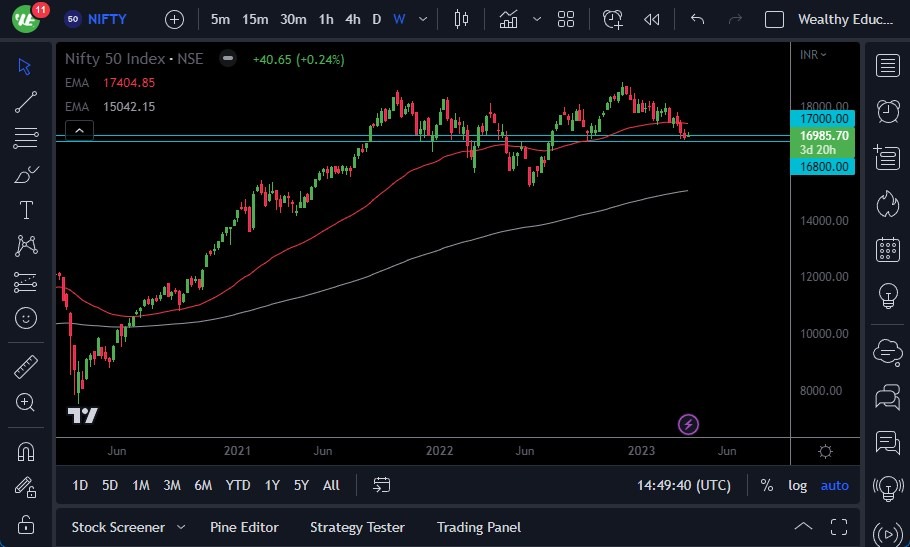
- The Nifty 50 has fallen over the last several days to pull back toward support, mainly around the ₹17,000 level.
- This does make a certain amount of sense because the global economy is in a state of flux, and of course, we had broken below the 50-Day EMA.
- The market breaking down below the ₹16,800 level could open up a move down to the 200-Day EMA, which sits near ₹15,200.
Overall, it looks like the Nifty 50 is going to hang around in some type of range, but it’s obviously a very bullish market in general. Remember, India outperformed everybody else after the pandemic started to turn the corner, so it’s possible that the Nifty 50 will outperform other indices going forward, especially if we can see some type of signs of strength in the global economy.
The Market Eventually Goes Looking Toward the ₹20,000 level
It’s also worth noting that the Indian rupee has been weak as of late, so that does help the idea of exports, and of course other service-related industries that India is so well known for. If that does end up being the case, then it’s possible that a move above the 50-Day EMA could open up a move toward the ₹18,500 level. If the market can break above there, then I think it eventually goes looking toward the ₹20,000 level, which is a long-term target given enough time.
On the other hand, if we turn around and break down below the recent swing low, which is ostensibly where the 200-Day EMA currently resides, then it would be a very negative turn of events because it would not only break down below that 200-Day EMA, but it would also form a larger “M pattern” or confirm some type of double top. It is a bit early to suggest that, but it is something that would become decided if we break down below that level, and it would more likely than not end up sending the Nifty 50 down to the ₹10,000 level over the longer term, with a bit of attention paid closely to the ₹12,000 level, an area that previously had been important. Either way, I think you have to look at this through the prism of a potential “buy on the debt market”, as it has outperformed so many of its peers around the world over the last couple of years.
 Ready to trade our Forex daily analysis and predictions? Here are the best Forex brokers to choose from.