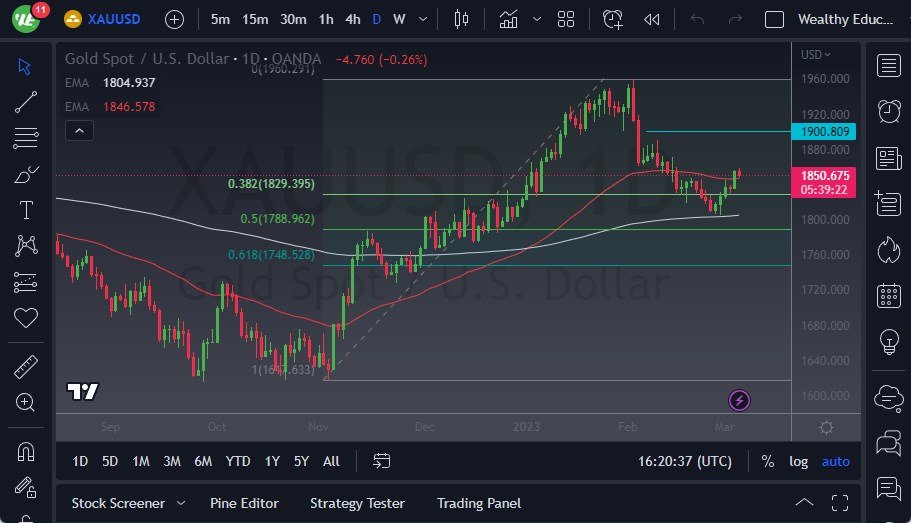
- Gold markets have rallied significantly during the trading session on Monday right off the bat, gapping higher, but then pulled back to test the 50-Day EMA.
- Ultimately, this is a market that will remain very noisy, and of course beholden to what’s going on with the US dollar and industries in the United States.
- As things stand right now, it seems as if the market is trying to go higher, but I can see several areas above that could cause major issues.
Selling Pressure at $1900
The first major issue that I see as the $1900 level, where we had formed several inverted hammer candlesticks just below. It’s obvious that there was a lot of selling pressure at the $1900 level, and therefore I think it remains a significant barrier. As long as we continue to see noisy trading out there, I think it’s probably only a matter of time before gold sees that same volatility. However, if we were to break above the $1900 level, the fight will not be over quite yet.
There are couple of major negative candlesticks that are sitting just above $1900 that should continue to cause some issues as well. Quite frankly, moves like that don’t happen in a vacuum, so now it becomes a question as to whether or not the selloff is over. I think that’s what we are trying to determine right now, and the fact that we have bounced from the 200-Day EMA is a good sign. However, it’s also worth noting that the bond market right now is essentially on fire, and that has caused a lot of noise in not only gold, but multiple other markets as well.
If we were to turn around and take out the $1800 level underneath, we would be breaking through the 50% Fibonacci level, the 200-Day EMA, and a significant area of previous support, not only from a structural standpoint but also from a psychological one. At that point, I would anticipate the gold would probably start to sell off quite drastically.
You will have to be very cautious with your position sizing at the moment, because quite frankly gold is very unstable, right along with other markets. However, if you have taken that turnaround from the 200-Day EMA, you are probably in an area where you are starting to add to your position.

Ready to trade our Gold price forecast? We’ve made a list of the best Gold trading platforms worth trading with.
