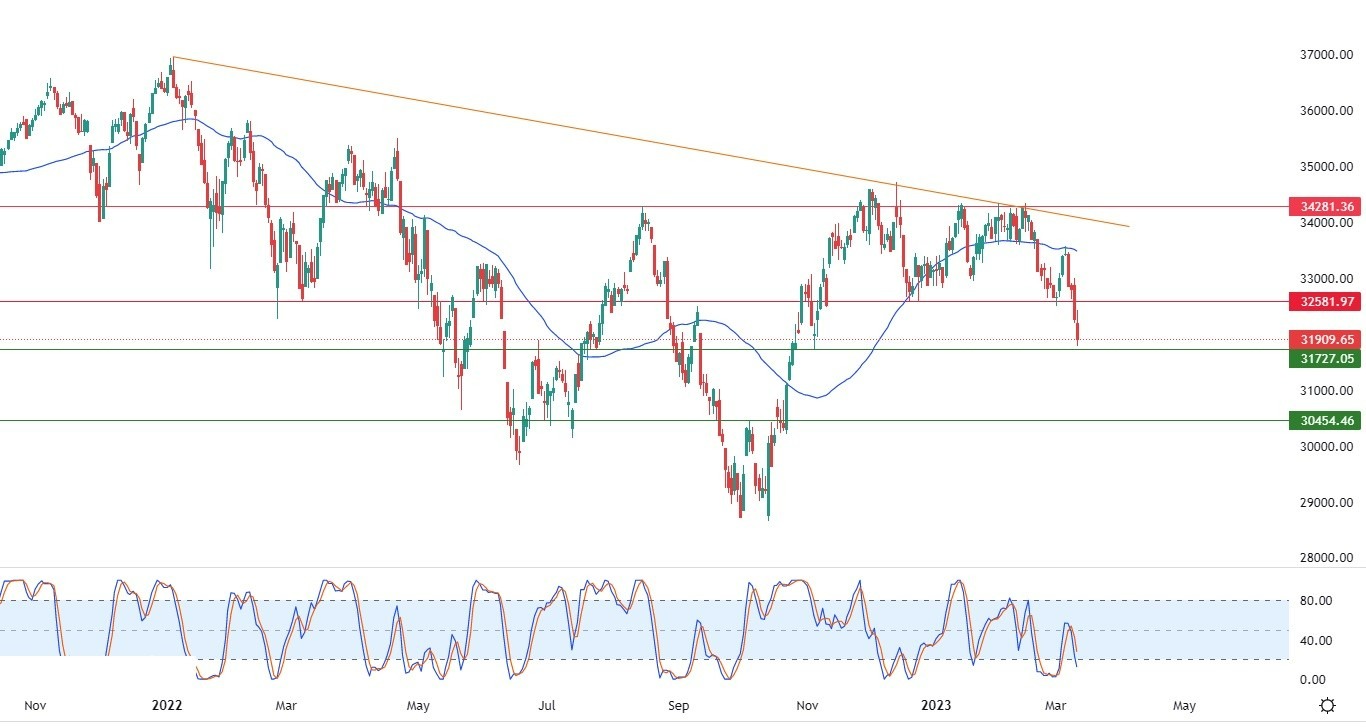
- The Dow Jones Industrial Average continued to decline during its recent trading on intraday levels, to record good losses in its last sessions by -1.07%.
- It lost about -345.22 points, to settle at the end of trading at the level of 31,909.65.
- It happened after a decrease in Friday’s trading by - 1.66%, for the fifth day in a row, in a week in which the index witnessed its worst weekly loss since June, with a rate of -4.43%.
On Friday, regulators took control of the Bank of California after its shares sank sharply, the biggest bank failure since 2008, as other banks suffered in the wake of the collapse of the Silicon Valley bank.
In economic news, the government revealed that Nonfarm Payrolls rose by 311K in February. This represents slower growth than the revised 504K seen in January, but still higher than the 223K that economists had expected.
With wage increases, a major contributor to headline inflation, continued strength in the labor market could pressure the Federal Reserve to continue raising interest rates.
On the other hand, unemployment rose unexpectedly to 3.6% and wage inflation eased, alleviating some concerns that the still-strong labor market would lead to a sharp increase in interest rates.
The market is currently pricing in a 40% chance that the Fed will raise its benchmark rate by 50 basis points at its next meeting, scheduled for later this month, the day before that probability was 68%.
This in itself represented a significant shift from earlier in the week, after hawkish comments from Federal Reserve Chair Jerome Powell on Tuesday caused a jump in the perceived likelihood that more rate hikes were on the way. Meanwhile, the market is still pricing in odds half a point higher than it was before the Fed chair spoke a week ago.
Dow Jones Technical Analysis
Technically, the index continues its decline with continuous negative pressure due to its trading below the simple moving average for the previous 50-day period. In addition to the presence of negative signals in the relative strength indicators, as shown in the attached chart for a period (daily). In addition, the bearish trend dominates the movement of the index in the medium-term and long-mile line.
Therefore, our expectations indicate a further decline for the index during its upcoming trading, as long as the resistance at 32,582 remains stable. Especially if it breaks the current support of 31,909.65, to then target the support level at 30,454.46.

Ready to trade our Dow Jones trading signals? Here are the best CFD brokers to choose from.
