


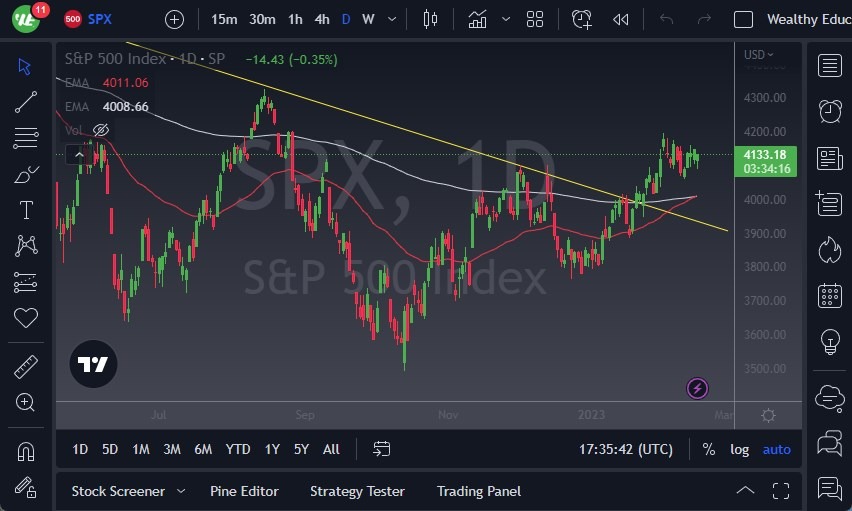
- The S&P 500 initially pulled back just a bit during the trading session on Thursday, only to find buyers underneath.
- By doing so, we ended up forming a slightly bullish candlestick, but we are still very much in the realm of massive consolidation.
- The 4100 level seems to be a bit of a magnet for the price, therefore that we need to pay close attention to it.
Ultimately, we break down below the bottom of the hammer for the trading session on Thursday, then I think we can look into the latest swing low, which is a little closer to the 4100 level itself. After we break down below there, then it’s likely that we go looking to the moving averages underneath. Speaking of those moving averages, the 50-Day EMA and the 200-Day EMA indicators, we are about to see them cross and form the so-called “golden cross.” While I’m not a huge fan of that indication, a lot of people do pay attention to it for a longer-term “buy-and-hold” type of signal. Nonetheless, it at least causes a bit of noisy behavior to say the least.
We Could Go Much Lower
If we were to break down below the bottom of the moving averages, then it’s likely that we could go much lower. In this scenario, we would not only be breaking below a couple of significant moving averages, but we would also perhaps be opening up the possibility of a move below that 4000 handles, which will attract a lot of attention in and of itself. At that juncture, then we have a move down to the 3800 level. The 3800 level is a swing low that I think a lot of people will pay close attention to. Below there, it’s like a trapdoor opening up.
On the other hand, if we turn around to break above the 4200 level, then I think it’s likely that we go looking to the 4300 level, followed by the 4400 level. This would obviously require Wall Street to go ahead and continue to ignore inflation and what the Federal Reserve is going to do, but they’ve done a fine job of doing exactly that recently. Because of this, I think you’ve got a situation where it looks like the buyers continue to come back into the picture and start buying again.
Ready to trade our S&P 500 analysis? Here’s a list of some of the best CFD brokers to check out.