


- During earnings season, it is not surprising that the S&P 500 stock index rate remains noisy, but Wednesday's session was unusually quiet due to the significant selloff that occurred on Tuesday, which may have released the built-up energy in the market.
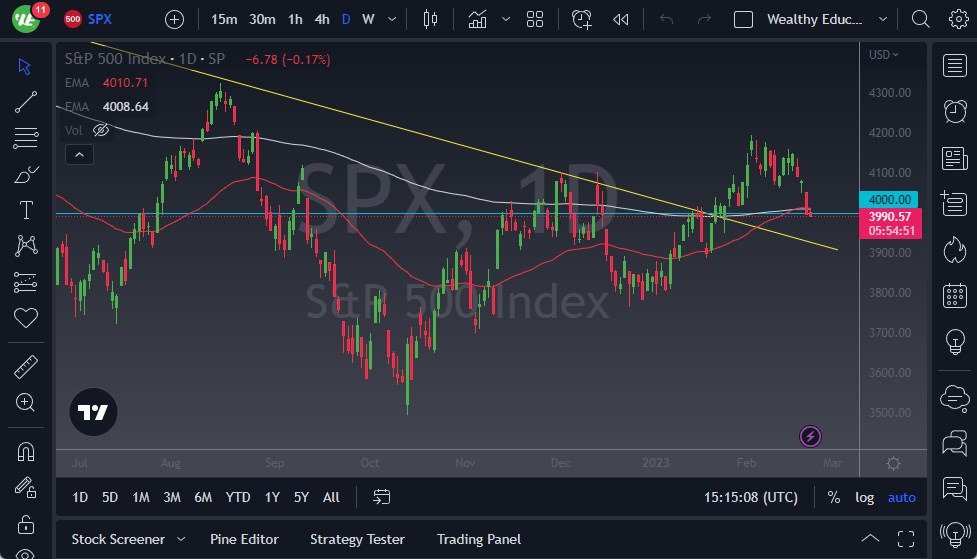
- Currently, the market is hovering around the 200-day and 50-day Exponential Moving Average (EMA) indicators, which are widely followed by traders worldwide.
- Moreover, the market is approaching a previous downtrend line, which could offer support now.
Focus on FOMC Minutes
The Federal Open Market Committee Meeting Minutes will undoubtedly impact stock traders' sentiment. Wall Street has focused on liquidity more than anything else over the past 14 years, despite the ongoing earnings season, which, in theory, should influence stock prices. Wall Street is more concerned about free and cheap money, a trend that has persisted since the Great Financial Crisis.
At present, the Federal Reserve's monetary policy is the most critical factor, and the question is whether they will continue to maintain a tight policy and for how long? The Federal Reserve is trying to convince the market that it will maintain its tight monetary policy for an extended period, which may not be well-received by Wall Street. Walmart's recent announcement after the bell on Tuesday suggested that consumers may face difficulties, which contradicts the narrative that Wall Street has been telling itself.
If the market breaks down below the 4000 level, it is highly likely that we may witness a downside momentum. On the other hand, if we see a rally that wipes out Tuesday's losses, we may witness the market going as high as the 4200 level, although that possibility seems less likely following the negative pressure that we have observed.
In summary, the S&P 500 remains noisy during earnings season, with Wednesday's session being unusually quiet. The market is hovering around the 200-day and 50-day EMA indicators, with a potential downtrend line offering support. The Federal Open Market Committee Meeting Minutes will have an impact on stock traders' sentiment, and the Federal Reserve's monetary policy is a critical factor at present. The possibility of a downside momentum exists if the market breaks down below the 4000 level, while a rally that wipes out Tuesday's losses may lead the market to the 4200 level, although that possibility is less likely following the negative pressure that we have observed.
Ready to trade our S&P 500 analysis? Here’s a list of some of the best CFD trading brokers to check out.