


- The S&P 500 index initially fell during the trading session on Friday, but continues to find buyers on dips as we continue to see plenty of narratives spun around the world.
- Wall Street is an absolute master technician when it comes to the idea of coming up with some type of positive narrative, and Friday was a perfect example.
- We initially sold off as people were worried about the Federal Reserve, but almost as soon as a couple of the Federal Reserve governor suggested that 50 basis point hikes were still on the table for the next meeting, people were on CNBC, Bloomberg, and other financial channels talking about how that is “just a minority of the FOMC voters.”
Buying Stocks Again
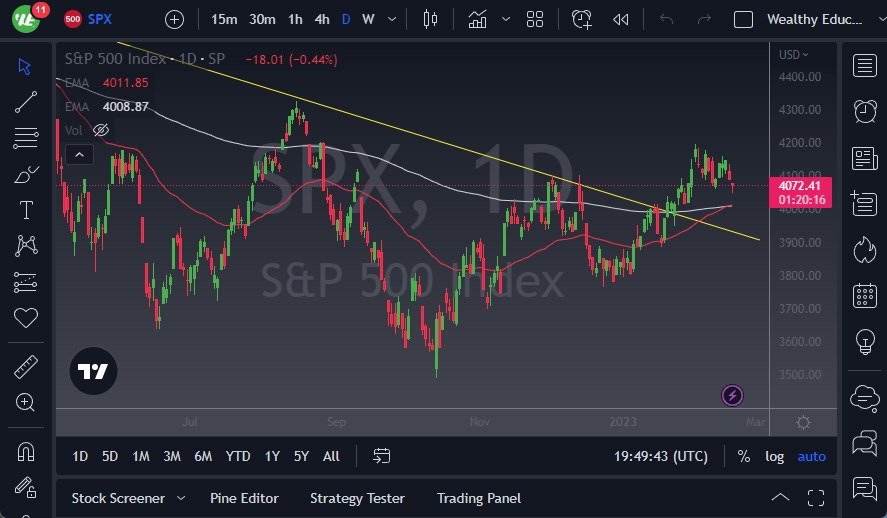
In other words, Wall Street got people to buy stocks again. It looks like we are trying to form some type of bullish flag, and clearly there are a million reasons to think that the stock market should fall. This is probably exactly why it’s going to rally at this point, because there are so many people out there looking to get short. Do not get me wrong, I don’t like the idea of buying stocks, but the technical analysis is screaming that there are plenty of people out there willing to do so.
The 50-Day EMA has broken above the 200-Day EMA, forming the golden cross. This is an indicator that a lot of people like to use for a “buy-and-hold” type of situation, but it’s very unlikely that it is reliable. Nonetheless, this is a reason that some people will jump in. Because of this, I like the idea of buying this dip, but I would also get out rather quickly as I don’t think the market has anything to keep it going in one direction or the other for a long amount of time. I think we continue to chop up people, accounts, and the market itself. Unfortunately, I just do not see the next move with any type of clarity, unless of course we break above the 4200 level which would be extraordinarily bullish. Underneath, if we were to break down below the 4000 level, that could send this market much lower. Nonetheless, right now it looks like we are just going to continue that painful grind.
Ready to trade the S&P 500 Forex? We’ve shortlisted the best CFD brokers in the industry for you.