


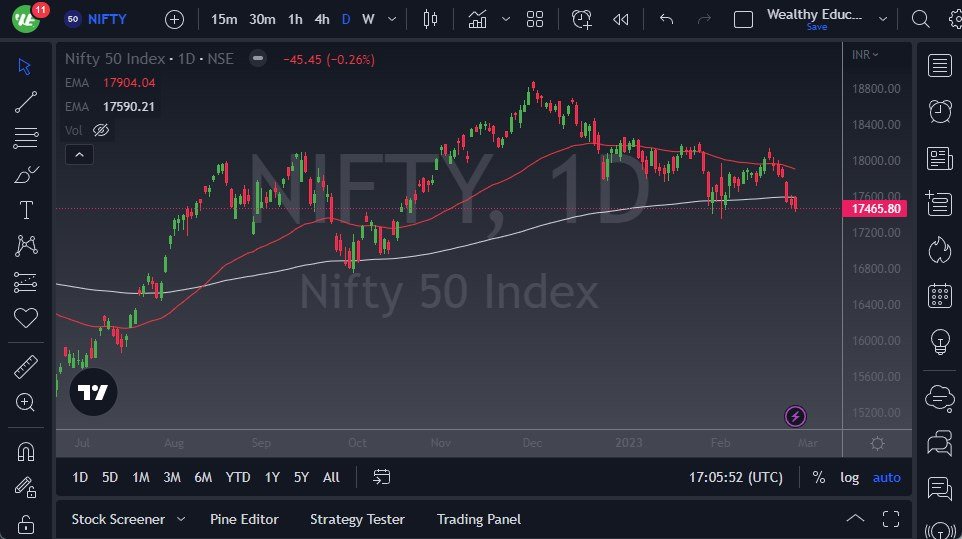
- The Indian Nifty 50 has fallen a bit during the trading session to break below the ₹17,500 level, but it is worth noting that we are still hanging around a previous pullback.
- This area has been supported more than once and I do think that it is probably only a matter of time before we have to make a decision as to whether or not we are forming a “double bottom”, or if we are about to break down significantly.
- For what it is worth, the market does seem lackluster at best.
Will the Nifty 50 Follow Other Global Indices?
The global indices around the world continue to look a bit mediocre as well, so that is something worth being cautious about. The overall risk appetite seems to have finally taken a hit, despite the fact that the market was so good at ignoring what was going on in the real world. Now that we are starting to see emerging markets suffer the brunt of inflation, it’ll be interesting to see how India performs. On the way up, the Nifty 50 has been very strong while a lot of other indices around the world had been weak. Now the rubber meets the road, and we will have to figure out whether or not we will continue to see that outperformance coming out of the Nifty 50, or if it will be dragged down by everybody else.
If we break down below the ₹17,250 level, then I think it’s likely that we go much lower, perhaps down to the ₹16,800 level. That was a major swing level that a lot of people will be paying close attention to, as we not only bounce from there, but we had bounced from the 200-Day EMA technical indicator. On the other hand, if we turn around and break higher, perhaps above the 200-Day EMA, then it’s possible that we could go looking to the 50-Day EMA which sits right around the ₹17,900 level. With this being the case, I think that the market has a lot to do in order to prove itself, and right now this is where it needs to do so. With this, be aware the fact that there’s going to be a lot of volatility, but eventually we should get some clarity. Ultimately, the next couple of weeks should determine where we go next.
Ready to trade our stock market analysis? Here’s a list of some of the best CFD brokers to check out.