


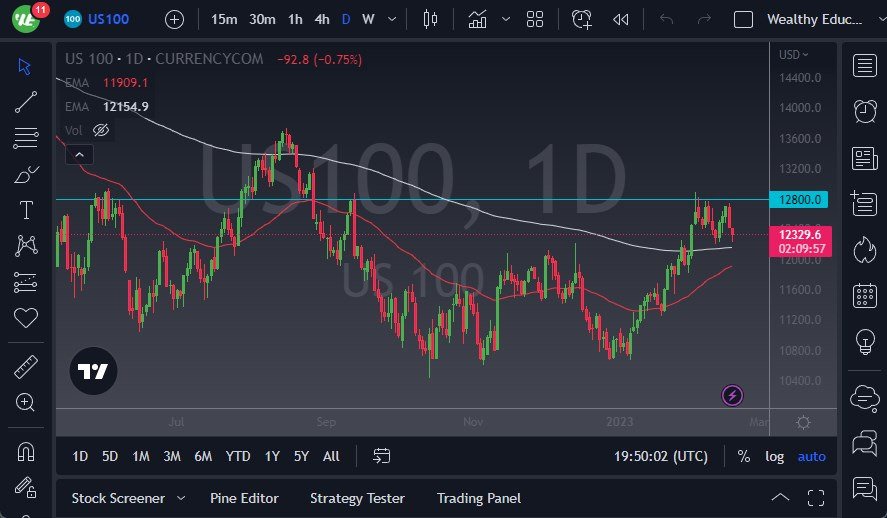
- The NASDAQ 100 index has fallen significantly during the trading session on Friday but seems to be finding support just below the trading session.
- The 200-Day EMA sits down there, and although it looked rather ugly at the open, we have turned around to show signs of semi stability.
- Because of this, I think it’s probably going to be a scenario where we continue to see buyers of dips, but I don’t necessarily like the idea of getting overly aggressive.
The 12,800 level above is significant resistance, where we had seen a lot of noise in the past. Alternatively, the 12,800 level continues to be important, just as the 200-Day moving average sits. We also have the 50-Day EMA underneath there and trying to rally to where the 200-Day EMA. With this being the case, I think the market continues to see a lot of back-and-forth, especially as we are going through the earnings season.
Keep in mind that Monday is Presidents’ Day in the United States, so the index itself won’t be open but there is definitely a sideways attitude here, and I think we should continue to look at it through that prism. Given enough time, we probably have to look at this through the prism of possible momentum building Brownian motion, and we could see a lot of inertia released because of that. Once we break out of this box, it’s more likely than not we are going to see a 500 point move, possibly even more in either direction.
Keep in mind that the NASDAQ 100 also is very sensitive to interest rates, which were all over the place during the day. With that being the case, you have to think that the market will continue to see plenty of volatility, especially as traders are still trying to come to grips with the idea that the Federal Reserve is going to stay tighter for longer. However, this seems to be something that people forget about on a daily basis, as the buyers come back in and pick everything up. There is really strange ability from Wall Street to whistle past the graveyard as it were, as the narrative changes almost on a daily basis, but it is almost always something bullish. Reality may or may not hit, but right now it looks like we are probably going sideways.
Ready to trade the NASDAQ 100? We’ve shortlisted the best CFD brokers in the industry for you.