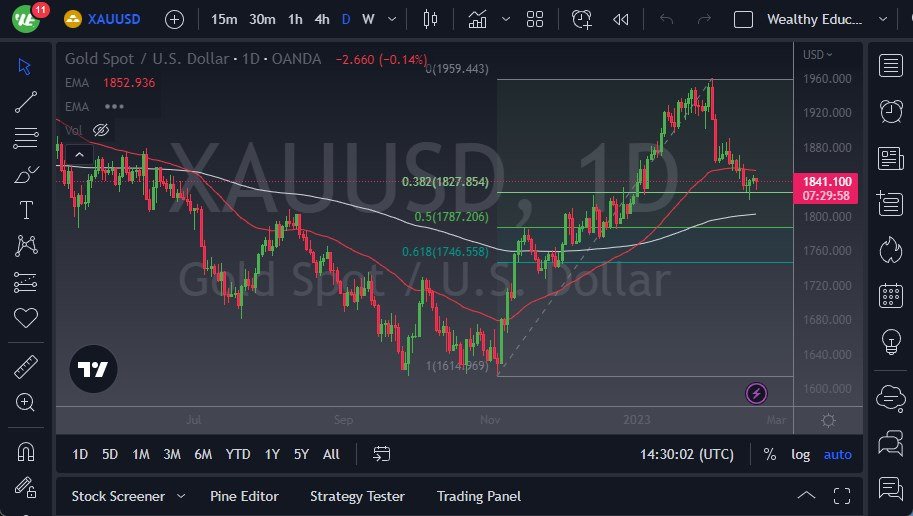
- On Tuesday, the gold market fluctuated back and forth around the 38.2% Fibonacci level.
- The level has found itself near the $1850 mark, and it appears to be trying to hold steady in this area.
- While the market is just below the 50-Day EMA, indicating slight technical resistance in that region, it is unlikely that there will be a significant aggressive stance.
Buyers Are Ready to Enter the Gold Market
The market showed an indication of strong buying support in the previous day's trading session, with a hammer formation. In case the market breaks below the hammer formation, we may see a shift to the 200-Day EMA. With the 200-Day EMA just above the $1800 level and the 50% Fibonacci level in that area, it will be an area that will attract a lot of attention. This is because it is a longer-term trend finding indicator, and many algorithmic systems are built on it. However, if the market breaks below that level, there is a gap on the chart close to the $1770 level, which means there will be several support areas for the buyers to come back into the market.
From a long-term perspective, the market has touched the top of a broad consolidation area that dates back several years. If the market can surpass the most recent high of $1975, it will undoubtedly open up the potential to reach the $2000 level. However, achieving this level will require considerable effort, starting with breaking above the 50-Day EMA. Once above that, the $1900 level, which has previously faced a significant amount of selling pressure, will be a crucial resistance level.
It is essential to keep an eye on the Federal Reserve's monetary policy, as it is expected to have an impact on the gold market. The Fed's monetary policy determines the strength of the US dollar, and since gold is priced in dollars, a weaker dollar typically leads to a higher gold price. Thus, if the Fed tightens its monetary policy, it will likely lead to a stronger dollar and a decrease in the price of gold.
In conclusion, while the gold market experienced some fluctuations, it is holding steady in the $1850 region. Buyers are likely to support the market if it falls further, and there is potential for the market to surge beyond $2000, but this will require significant effort.

Ready to trade today’s Gold prediction? Here’s a list of some of the best Gold brokers to check out.
