


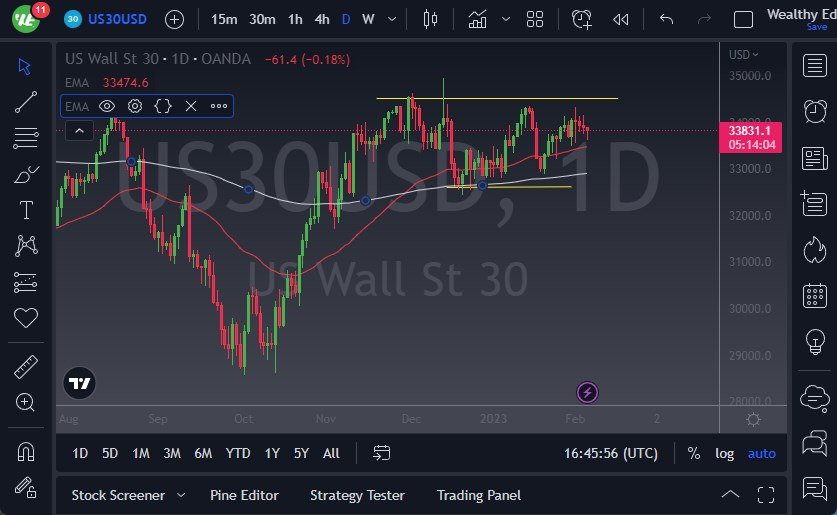
- The Dow Jones Industrial Average has fallen a little bit during the trading session on Monday but continues to see the 50-Day EMA underneath offers a certain amount of support.
- By falling that way we have to turn around and show signs of life, it suggests that the market is probably going to continue to see a little bit of a fight in general.
- If we were to break down below the 50-Day EMA, then it opens up the possibility of a move down to the 200-Day EMA, which currently sits right around the 33,000 level.
Keep an Eye on Fundamentals
Keep in mind that we are in the midst of earnings season, so that certainly has a major influence on what happens next, especially as the outlook is so cloudy. Market participants will continue to focus on the latest earnings, but also the macroeconomic situation in general. Keep in mind that there are a lot of different things out there that could cause a certain amount of issues, not the least of which would be the interest rate situation as the Federal Reserve looks likely to have to keep very tight due to the most recent jobs number being hotter than anticipated. In other words, it’s a bit difficult to imagine a situation where a lot of risk appetite is suddenly going to reenter the market, but let us not forget that if Wall Street is good at one thing, it’s coming up with the latest “narrative” that traders will start to gamble on.
If we were to break down below the 200-Day EMA, I believe that could open up a move down to the 30,000 level, an area that obviously has a large round, psychologically significant feel to it, and will attract a lot of attention as it has a couple of times in the past. If we were to break above the 35,000 level, then the market will enter a move higher yet again, and therefore it’s likely that we would see quite a bit of upward momentum and “FOMO trading” coming back into the picture as we have a couple of times in the past. The market has been very choppy as of late, so don’t be surprised if we get more of the same in the short term.
Ready to trade the Dow Jones 30? We’ve shortlisted the best Forex brokers for CFD trading in the industry for you.