Bullish view
- Buy the BTC/USD pair and set a take-profit at 26,000.
- Add a stop-loss at 23,500.
- Timeline: 1-2 days.
Bearish view
- Set a sell-stop at 24,000 and a take-profit at 23,000.
- Add a stop-loss at 25,500.
The BTC/USD price remained calm and collected below the year-to-date high of 25,250 as the focus remained on the upcoming Fed minutes. Bitcoin was trading at $24,632, where it has been in the past few days. The minutes will provide more information about what to expect in the coming months.
Analysts at Goldman Sachs believe that the Fed has more than 0.75% rate hikes to implement in the coming months. This means that the Fed will deliver three more 0.25% hikes through March and then move to a strategic pause to assess the situation.
Bitcoin remained steady even as American stocks plunged. The Dow Jones shed over 700 points while the tech-heavy Nasdaq 100 index shed over 270 points.
BTC/USD daily chart analysis
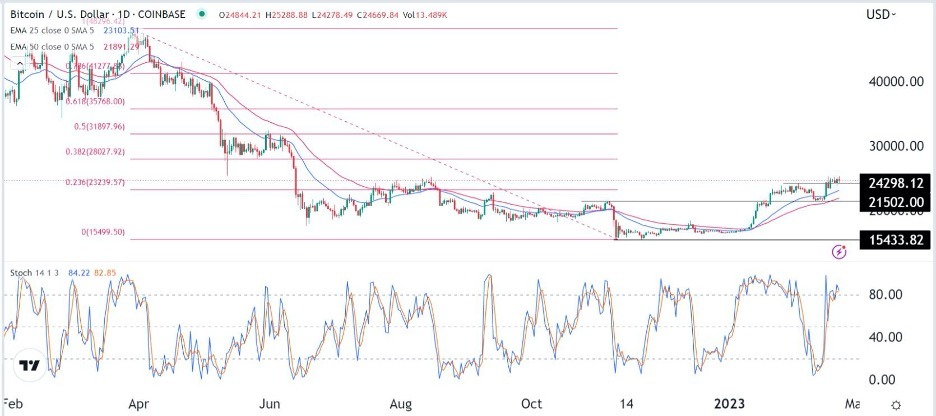
Bitcoin has been in a strong rally after it settled at a low of 15,433 in November. The pair has managed to flip several important resistance levels into support. For example, it moved above the resistance of 21,502, the highest point on November 5. Last week, it formed a break-and-retest pattern when it retested the new support.
The pair also retested the key resistance point at 24,298, the highest level in February. It has moved above the 23.6% Fibonacci Retracement level. It is supported by the 25-day and 50-day moving averages. The Stochastic Oscillator has moved above the overbought level.
Therefore, the pair will likely maintain its bullish trend as buyers attempt to completely flip the resistance at 25,000 into the new support. If this happens, the next level to watch will be at 26,000. The bullish view will become invalid if bears manage to push it through the support at 21,502.

Bitcoin price forecast
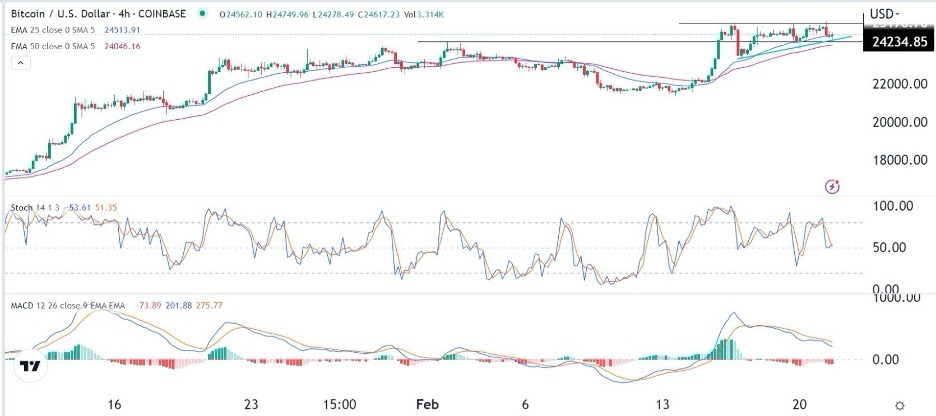
On the four-hour chart, the pair is hovering slightly above the key support at 24,234. It is also consolidating slightly above the 25-day and 50-day moving averages while the Stochastic Oscillator has moved to the neutral point at 50. It has also formed a small ascending triangle pattern. The MACD has formed a bearish divergence pattern.
The pair will likely have a bullish breakout above the resistance point at 25,000 before or after the FOMC minutes. A drop below the support at 24,000 will open the door for more downside.
Ready to trade Bitcoin in USD? We’ve shortlisted the best crypto brokers in the industry for you.
