Bearish view
- Sell the BTC/USD pair and set a take-profit at 22,000.
- Add a stop-loss at 24,000.
- Timeline: 1-2 days.
Bullish view
- Add a buy-stop at 23,500 and a take-profit at 25,000.
- Add a stop-loss at 22,000.
Bitcoin price was a bit flat on Thursday morning as the market pondered the latest action by the Federal Reserve. In its first meeting of the month, the Fed’s decision was in line with what most analysts were expecting. It hiked rates by 0.25% for the first time in six meetings and pushed the rate at between 4.50% and 4.75%. The BTC/USD pair was trading at 23,131, a few points below the year-to-date high of 23,930.
Bitcoin price 4H analysis
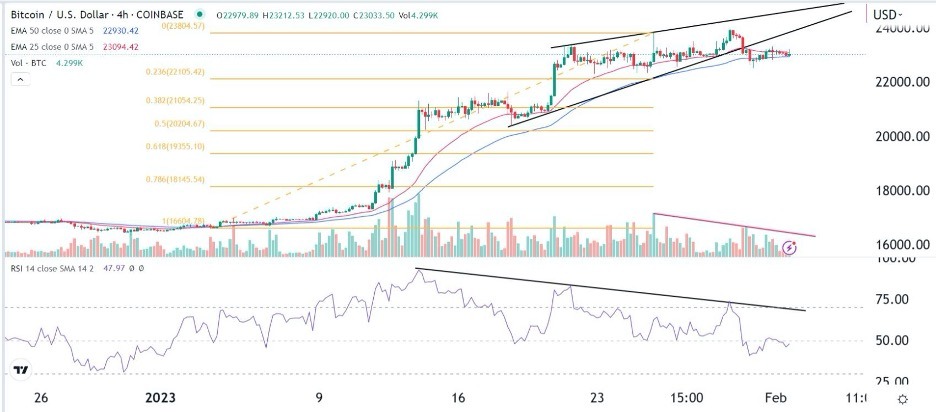
Bitcoin has been forming an alarming rising wedge pattern on the 4H chart. This pattern is clearly identified by joining the highest peaks since January 23rd and the lowest points since January 13. In price action analysis, this pattern usually leads to a bearish breakout when the wedge nears its confluence level. This bearish breakout has already happened although volume has been in a downward trend.
Meanwhile, trend indicators like moving averages and Bollinger Bands have been moving horizontally, showing that the coin has had mild volatility. At the same time, as shown below, the Relative Strength Index (RSI), which measures the speed of change of an asset, has formed a bearish divergence pattern. In technical analysis, a bearish divergence usually sends a warning that an asset’s price will continue falling.
The BTC/USD price has moved slightly above the 23.6% Fibonacci Retracement level. Therefore, the four-hour chart points to more sustained bearish trend in the coming days. If this happens, the reference point will be at the psychological level of 22,000 (January 20 low).
On the flip side, a volume-supported rebound above 23,530 will signal that there are still more buyers who are keen to push it above the resistance level at 24,000.

BTC/USD 2H analysis
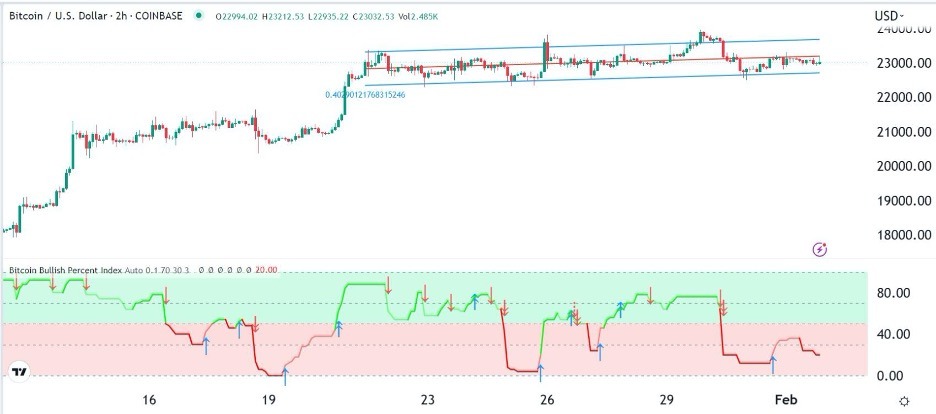
On the two-hour chart, the BTC/USD price has remained flat in the past two trading sessions. It is consolidating between the lower and middle lines of the regression trendline. At the same time, the Bitcoin Bullish Percent Index has moved to the oversold level of 20.
Therefore, in the immediate short-term, the pair will likely continue consolidating between the regression channel at 22,735 and 23,680. A drop below the lower side of the channel will signal that bears have prevailed and push it to the next psychological point at 20,000. On the other hand, a recovery could push it above the psychological point at 24,000.

Ready to trade our free Forex signals? Here are the best Forex brokers to choose from.
