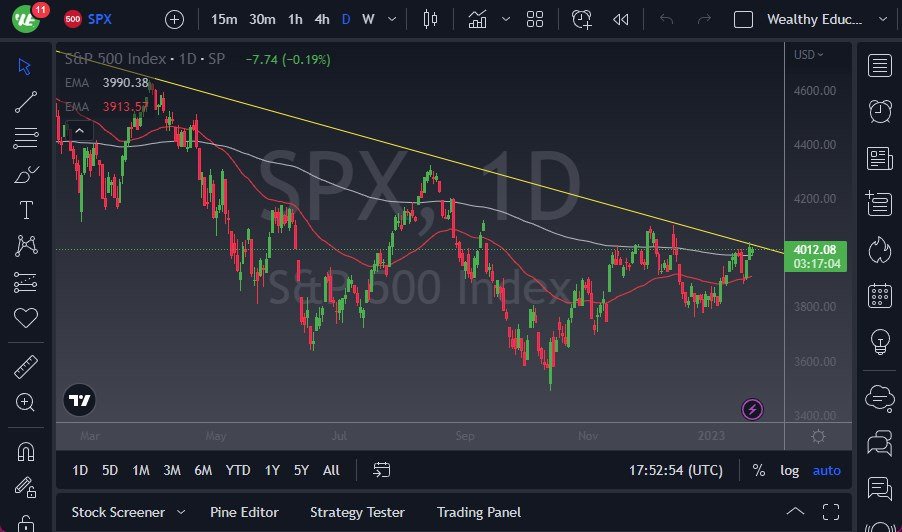
- The S&P 500 Index has gone back and forth during the trading session on Tuesday as we continue to hang around between the 200-Day EMA and the downtrend line, and therefore it seems as we are being squeezed at the moment.
- This typically happens right before a bigger move, and the fact that we are in the midst of earnings season is probably something that you should be cognizant of.
NASDAQ 100 Today's Trading Scenarios
If we were to break down below the bottom of the 200-Day EMA, then it’s likely that we could drop down to the 50-Day EMA. Anything below the 50-Day EMA has me shorting this market aggressively, because I think that we could go down to the 3800 level, possibly even the 3600 level. All it would take is some extraordinarily bad news, which is something that I’m almost certain we are going to get sooner or later. The Federal Reserve has a meeting on February 1, and that could be the catalyst for a bigger move.
All things being equal, if we break above the downtrend line, then it’s possible that we could see a move to the 4200 level, where I think you would see a lot of resistance. Regardless, it’s obvious that Wall Street is fighting and trying to push the market higher regardless of reality. Again, just as I said in my NASDAQ 100 video today, you cannot argue with the market. It doesn’t matter if the market “has it wrong”, it can stay much more irrational for a much longer amount of time than you can stay solvent.
At this juncture, I think we are on the precipice of a bigger move, but I don’t necessarily know it’s going to happen right away, but the next major impulsive candlestick should give us an idea as to where we are going over the next couple of weeks. Keep in mind that the markets tend to be overdone in one direction or the other occasionally, and I don’t see this being anything different. I would be a bit surprised if we broke above the 4200 level, but that is a potential target if nothing else. The only thing I think you can count on is that it is going to remain choppy as we are in the midst of the earnings season.

Ready to trade the S&P 500 Forex? We’ve shortlisted the best CFD brokers in the industry for you.
