


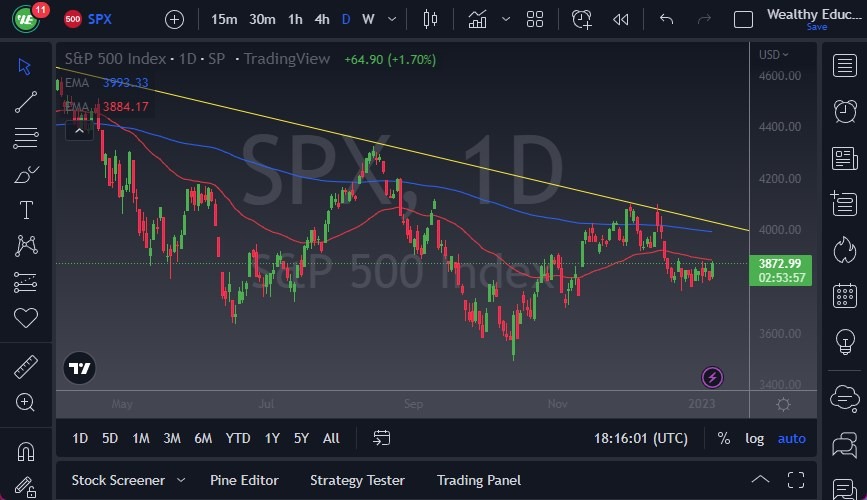
- The S&P 500 E-mini contract rallied a bit during the Friday session after the job summer came out, slamming into the 50-Day EMA.
- Keep in mind this contract has been going back and forth for a while, and therefore it’s likely that we would see a continuation of this behavior, especially as we have had the 50-Day EMA sitting just above, which attracts a lot of attention.
- Furthermore, we also have the 3900 level, and then the 200-Day EMA near the 4000 level. In other words, I think it’s going to be very difficult to continue to go higher, and I think it’s probably only a matter of time before exhaustion gets involved.
On signs of exhaustion, I would not hesitate to start shorting this market, since the economic outlook is so poor. Furthermore, there is so much in the way of resistance above that we have quite a bit of negativity in that area. If we break down below the 3800 level, then the market could really start to take off to the downside. After all, a lot of what we have seen on Friday was simple “hopium” out there, as people are looking at the shrinking wage inflation as a sign that perhaps the Federal Reserve will finally give Wall Street what it wants. At the end of the day, I think this is going to be a nice shorting opportunity, so I’m just going to wait to see whether we pull back at this point, or if we see sides of exhaustion.
Market Likely to Hit the 4300 Level
If we break above the downtrend line above, then I think we go much higher. The 200-Day EMA, and the 4000 level would be an area that would be difficult to get beyond, so that would show real strength. At that point, the market is likely to go looking to the 4300 level. All things being equal, this is a situation where we would have to see a major shift in the overall economic outlook to see this market really take off. After all, the only thing Wall Street tends to care about is whether they are going to get cheap money coming out of the Federal Reserve. At this point, it looks very unlikely, despite what Friday may have led some people to believe.
Ready to trade the S&P 500 Forex? We’ve shortlisted the best CFD brokers in the industry for you.