


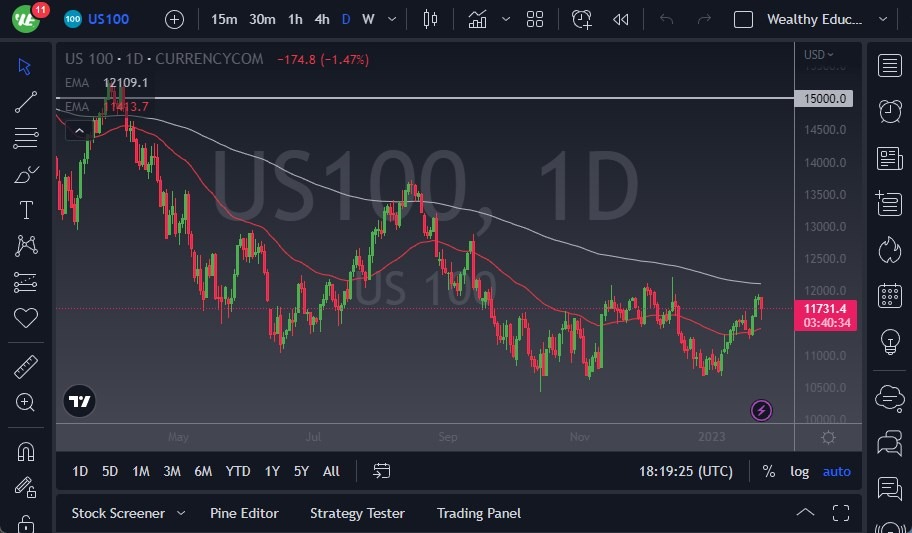
- The NASDAQ 100 initially sold off rather hard during the day on Wednesday, reaching down to the 11,550 level.
- However, we turned around to show signs of strength later in the day, after the initial shock. Microsoft kicked off the day on the wrong footing, giving a horrible outlook going forward.
- This obviously had a major influence on the NASDAQ 100 as you would expect.
We have seen the market turn right back around and show signs of life, as the permanently bullish have stepped back into the market. The 50-Day EMA sets just underneath, and it suggests that there could be a few buyers in that general vicinity. If we can continue to see this type of action, it looks like we will threaten the 200-Day EMA, which is not a huge surprise considering just how permanently bullish Wall Street seems to be.
Volatility Ahead
They are waiting to see whether the Federal Reserve is going to give them cheap money on February 1, or at least start to hint that they are thinking in the other direction. I think they are going to be horribly disappointed, but in the meantime, it’s worth noting that there is a blackout period for the Federal Reserve governors, and therefore there will probably be very little to shock the markets.
If we were to take out the 200-Day EMA, which sits just above the 12,000 level, then the market could go to the 13,500 level. Ultimately, this is a situation that looks as if we are trying to form a double bottom, and I am having trouble finding pundits that work at firms on Wall Street that are getting bearish again. This is probably a negative sign if I’ve ever seen one. However, in the short term, it certainly looks as if you must be thinking in one direction, but I do think that we are rapidly approaching a potential sticky area. Ultimately, I think you continue to see a lot of volatility over the next few trading sessions, but I don’t know for quite ready to take off since there will almost always be some type of narrative out there during the earning season that will come into the picture and cause chaos as per usual.
Ready to trade the NASDAQ? We’ve made a list of the best CFD brokers worth trading with.