


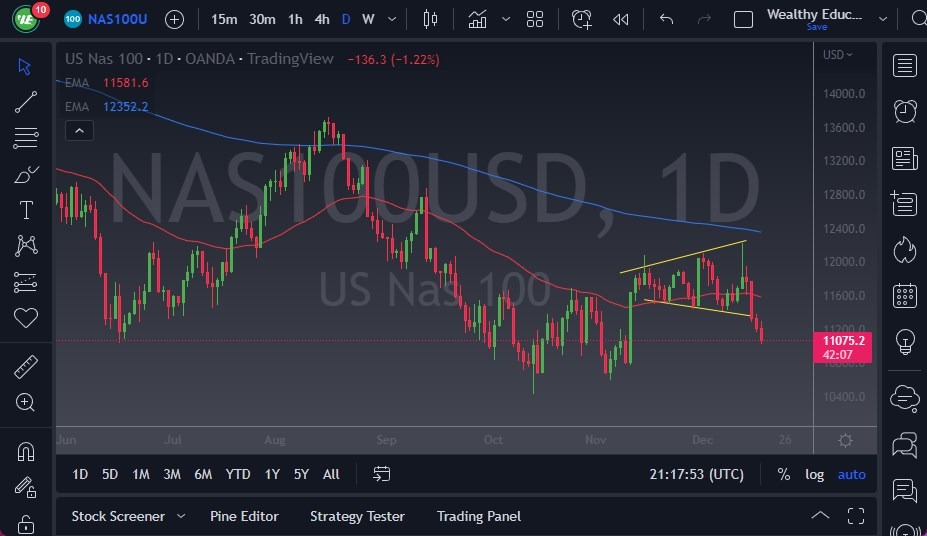
- The NASDAQ 100 plummeted again during the trading session on Monday as we continue to fall through the floor.
- At this point, it looks as if we are going to threaten the lows again near the 10,600 level, perhaps even lower than that.
- If we break that area, it opens up the 10,500 level, followed by the 10,000 level.
- Quite frankly, I’ve heard a lot of nonsense over the last couple of weeks about how the Federal Reserve was going to back off, and Jerome Powell has made it obvious that he’s not interested.
With all that being said, I do think that the NASDAQ 100 will continue to take a bit of a beating because quite frankly it’s very sensitive to interest rates. As long as that’s going to be the case, and interest rates of course remain very tough and elevated, that is a very negative turn of events. We have just broken out of a massive megaphone pattern, which is a sign that volatility was picking up, and now the sellers have taken control.
Look at Rallies as Selling Opportunities
At this point, any time this market rallies I think it is going to end up being the selling opportunity, especially near the 11,350 level, which would be the bottom of that megaphone. We also have the 50-Day EMA in the same neighborhood, which comes into the picture as potential a technical analysis resistance barrier. Anything above there could get to be interesting, but at this point, I find it difficult to imagine markets are suddenly going to take off.
If anything, we probably have a situation where some type of sudden headline could rock the markets, but it will more likely than not be negative. In that scenario, I do think that we not only test the bottom that we recently made but break it down even further. The 200-Day EMA is sitting at the top of the megaphone pattern, and therefore it does make a certain amount of sense that we would see that as a massive ceiling in the market. If we were to somehow turn around above there, then you could stop arguing about the trend, but right now we are a lifetime away from there, and I think that will continue to be the way to look at this market, through suspicion and mistrust.
 Ready to trade the NASDAQ 100? We’ve shortlisted the best CFD brokers in the industry for you.