


- The Dow Jones Industrial Average declined during its recent trading on intraday levels, to break a series of gains that lasted for two days.
- It recorded losses in its last sessions, which were characterized by volatility at a rate of -0.42%, to lose about -142.29 points, and settling at the end of trading at the level of 33,966.36.
- This happened after rising During trading on Tuesday, it increased by 0.30%.
[CAD:EN - 2 - Advantage of today's market]
The index reversed course and moved sharply lower after the Federal Reserve's Monetary Policy Committee's initial decision statement. The central bank raised interest rates by 50 basis points as was widely expected, but hawkish expectations by policymakers on the size of the 20-year interest rate hike the next three years are what troubled investors.
The Fed said it now expects its benchmark interest rate to be above 5% in 2023, up from the median forecast of 4.6% previously issued.
Fed Chairman Powell and other members of the Federal Open Market Committee indicated on Wednesday that they would still like to see meaningful progress in pushing inflation down to their annual target of 2%.
“It will take more evidence to give confidence that inflation is on a sustainable downward trajectory,” Powell said in a post-meeting news conference.,“Price pressures remain evident across a broad range of goods and services.”
Dow Jones Technical Analysis
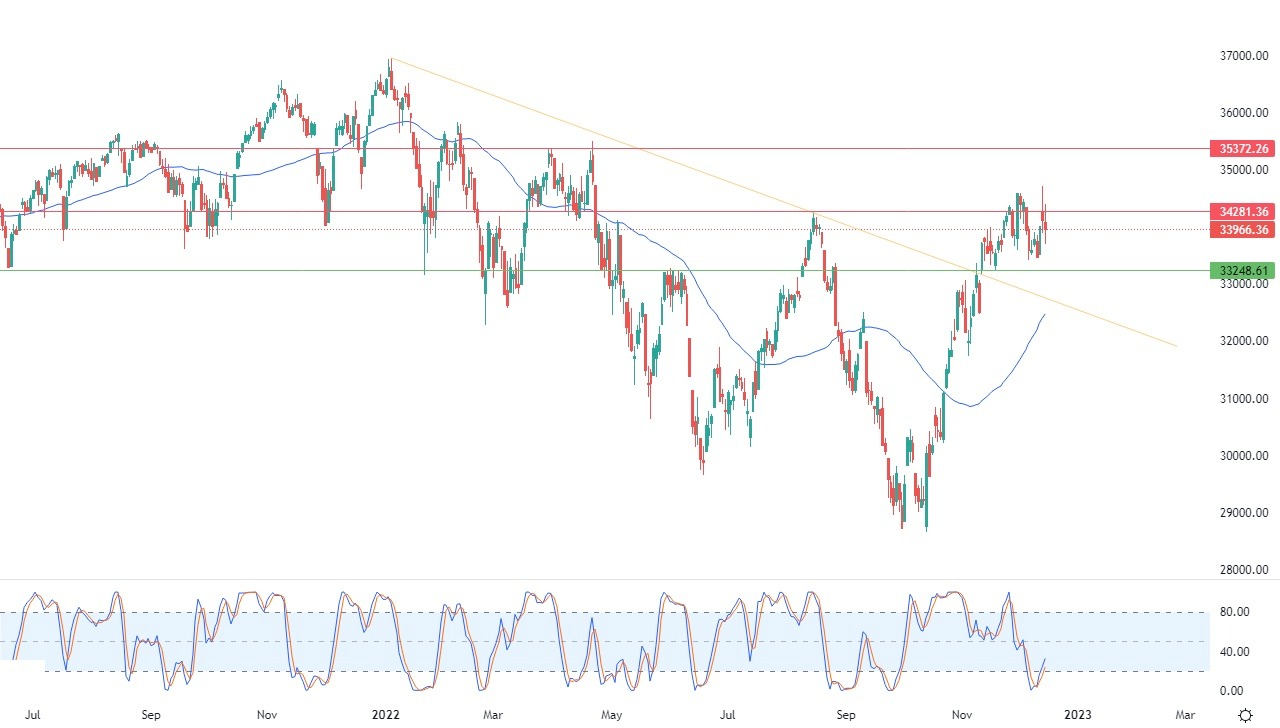
Technically, the index's decline came as a result of the stability of the important and stubborn resistance level of 34,281.36, to try again to gain some positive momentum that might help it breach this resistance. Especially with the start of positive signals in the relative strength indicators, after reaching areas that are highly saturated with selling operations, in an exaggerated manner.
It is compared to the movement of the index, forming what is known as positive divergence in it, considering its impact on the earlier breach of a bearish corrective slope line in the short term. This is shown in the attached chart for a period (daily), with the continuation of positive support for its trading above its simple moving average. for the previous 50 days.
Therefore, our expectations suggest that the index will rise again during its upcoming trading, provided that it first breaches the 34,281.36 resistance level, to then target the 35,372.30 resistance level.
 Ready to trade the Dow Jones in Forex? Here’s a list of some of the best CFD brokers to check out.