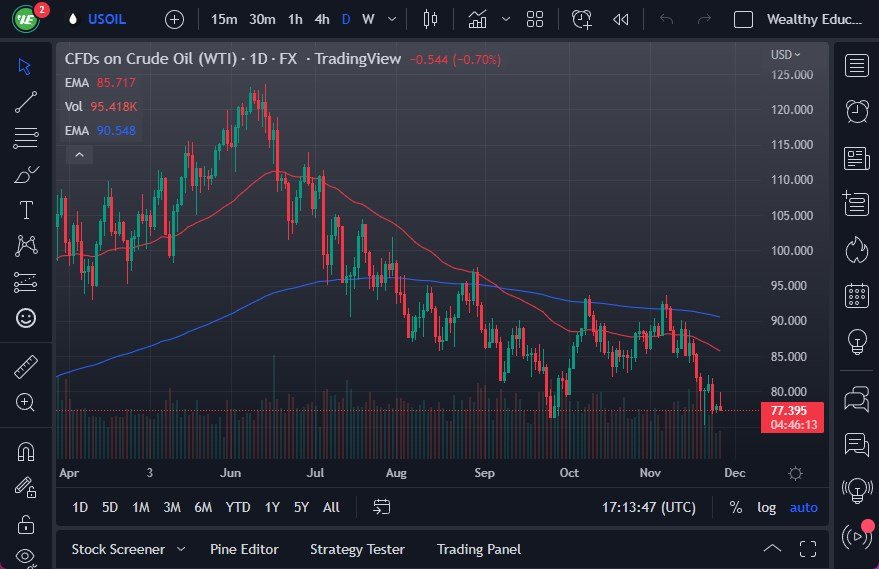
The West Texas Intermediate Crude Oil market has rallied a bit during the early hours on Friday but found enough resistance near the $80 level to turn things around and show signs of exhaustion. By forming an inverted hammer, it does suggest that we are about to get some type of big move, depending on which way we break.
Global Recession Is Working Against Crude Oil Demand
- Currently, crude oil traders are trying to determine whether or not the lack of supply is going to be a major factor, or if it’s going to be about the lack of demand.
- The global economy seems to be heading towards a recession, and that of course would work against the demand equation and therefore the price of crude oil.
- The crude oil markets breaking down below the hammer from earlier this we could open up the floodgates of selling, perhaps sending WTI below the $75 level.
- If that happens, then we could see a lot of “risk off” behavior around the markets as crude oil is widely followed.
On the other hand, if the market were to turn around a break above the top of the inverted hammer, clearing the $80 level, then it allows the possibility of a move to the $82.50 level, maybe even the 50-Day EMA. That is a technical indicator that a lot of people pay close attention to, so it should attract a certain amount of trading activity.
The double bottom could be the bottom of the market altogether, but then again it may just be a stop to much lower pricing. We have been in a downtrend for a while but it should be noted that on longer-term charts, this is a general vicinity that has been important more than once. I do believe that by the end of the year, we should have a little bit more clarity when it comes to this market, but between now and then it’s probably going to be a lot of chippy trading as we try to sort things out. Other things you should pay attention to would be the US dollar, interest rates rising, and of course the stock market in general as it could give you an idea of risk appetite. Ultimately, this is a market that has to make a lot of serious decisions in the next couple of candlesticks.

Ready to trade WTI/USD? Here are the best Oil trading brokers to choose from.
