


- The S&P 500 has rallied a bit during the trading session on Monday, as we continue to see a lot of volatility.
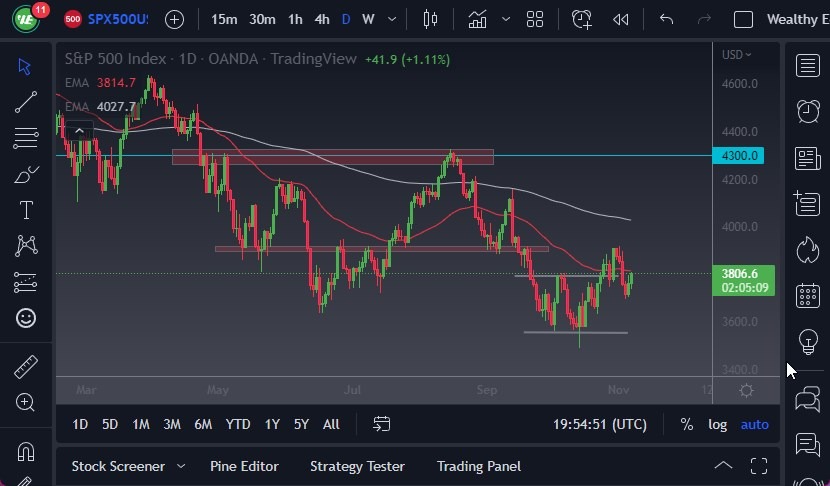
- The market is sitting right around the 3800 level. The 3800 level has been difficult to get beyond a couple of times, but the question now is whether we can finally make it stick. The market seems to be waiting for some type of confirmation that the Federal Reserve will pivot.
- Quite frankly, it’s just setting itself up for disappointment. At this point, it’s likely that we will continue to see signs of exhaustion as selling opportunities, but at this point, it looks like the short-term momentum is to the upside.
The Federal Reserve has several speakers this week that could come out and cause problems, so I suspect that it’s only a matter time before the Bears come back down. It will break down below the lows of the last couple of days, it’s likely that the market could go down to the 3600 level. That is a large, round, psychologically important figure. At this point, that is an area where it’s likely that we would see a lot of momentum to break out of this range, but quite frankly we could very well see some type of shock to the system as somebody somewhere will say something.
Be Cautious
When I look at the chart, it looks as if we are trying to form some type of bottoming pattern, but at this point, we have not proven it quite yet. Yes, we had broken the above resistance at one point, but then turned around to show signs of weakness, to begin with. The 50-Day EMA will offer a certain amount of interest, but really at this point if we can break above there is possible that we could go to the 3900 level, and then perhaps even the 4000 level where we have the 200-Day EMA.
Looking at this chart, it’s likely that we will continue to see a lot of volatility, but that should be nothing new if you been playing the market anytime recently. I think at this point, you need to be very cautious with the position size that you use because quite frankly I think we are going to see more volatility, not less of it going forward.
Ready to trade the S&P 500 Index prediction today? We’ve shortlisted the best Forex brokers for CFD trading in the industry for you.