


- The US dollar has pulled back ever so slightly against the Canadian dollar during the Friday session, a day that was generally US dollar positive.
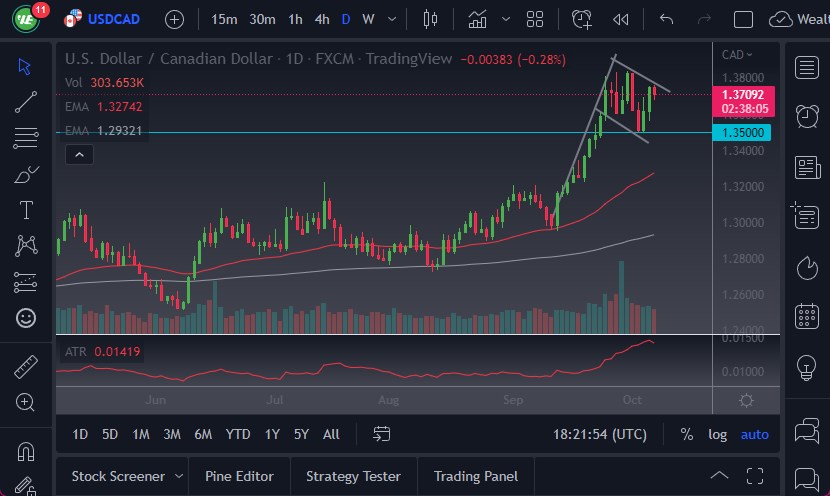
- By pulling back the way we have, it looks like we are going to continue to build a potential bullish flag, something that’s worth paying attention to.
- This is especially interesting considering that even though the market was negative, it was not all that negative, on a day that saw a lot of crude oil strength.
The USD/CAD Could Rise to 1.46
Looking at this chart, the 1.35 level should continue to offer a lot of support, and it is roughly where the bottom of the flag sits. Based upon the measured move of the pole, if we do break out, this is a market that could go looking toward the 1.46 level. We will have to pay close attention to the oil market as well as the US dollar overall, because the oil market really starts to take off, and may negate this pattern. I think at this point, you are more likely than not will see a lot of choppy behavior, as we continue to fill out the flag itself.
In the scenario that we break down below the bottom of the flag, then I think at that point we could drop down to the 1.33 area, where the 50-Day EMA is hanging around. The 50-Day EMA is a dynamic support level a lot of people pay close attention to, so in that situation, I believe it is probably only a matter of time before we see buyers try to pick up value in that area. Anything below the 50-Day EMA could be thought of as a potential trend change, but we are so far away from that happening right now it is only a distant thought.
The breaking of the top of the bullish flag opens up the next leg higher, but keep in mind that this pair does tend to be very choppy under the best of circumstances, so even if we do rally, it’s going to take a lot of patience in order to collect all of the profits that are going to be offered. We will get the occasional pullback, and that will shake out a lot of traders. Ultimately, I do think that’s the most likely of outcome, but anything is possible at this point.
Ready to trade our Forex daily forecast? We’ve shortlisted the best Forex trading brokers in the industry for you.