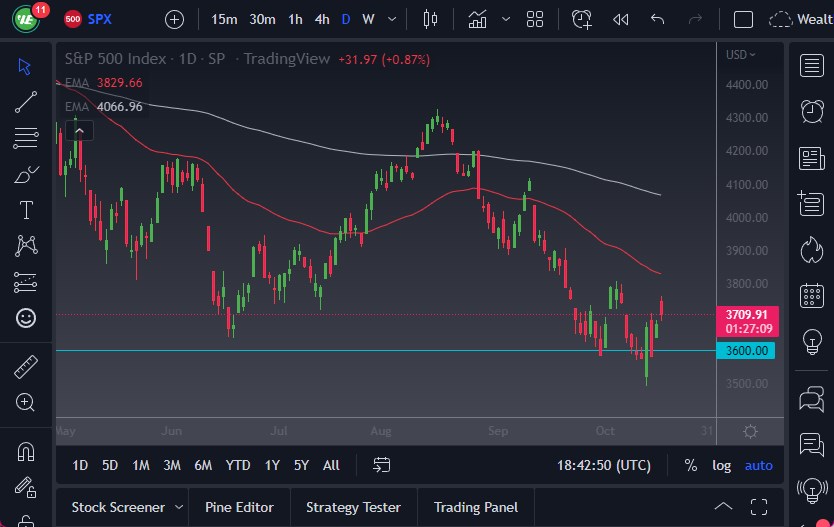
The S&P 500 has fallen during the trading session after initially shooting straight up in the air. At this point, the market looks as if it is vulnerable to selling pressure, and therefore I think you need to pay close attention to any negative it behavior. The 3700 level looks as if it is going to be tested, and think it’s probably not a huge surprise if it does get violated and broken to the downside.
The 50-Day EMA sits above the 3800 level and is dropping rather quickly. I think that ends up being a ceiling in the market going forward, as we continue to see a lot of downward pressure and reasons to think that risk appetite will continue to fail. After all, the world looks as if it is going into a global recession, and the companies that make up the S&P 500 are all pretty much international, meaning that even if the United States were to retain strength, the reality is that the rest of the world is going to slow down and that obviously is going to have a negative impact on earnings.
Reasons for market drops
Speaking of earnings, we are in the midst of earnings season and traders will now start to pay attention to not only earnings reports, but guidance going forward. At this point, it’s difficult to imagine that most guidance will be very rosy, so it’s likely that we are going to continue to see plenty of reasons for the market to drop. The market dropping from here does make quite a bit of sense, as the Federal Reserve continues to tighten monetary policy and quite frankly it looks like the supply chain is still somewhat uneven to say the least. With that being the situation, I think it’s probably only a matter of time before we drop back to the 3600 level.
- Any violation of the 3600 level will more likely than not have people looking to short the market even more aggressively, and therefore we could get a huge flush lower.
- On the other hand, we can take out the 50-Day EMA to the upside, it’s possible that the S&P 500 E-mini contract might try to target the 4000 level over the next several weeks.
- Ultimately, we are in a downtrend and that’s something that you cannot ignore.
Ready to trade our S&P 500 analysis? Here’s a list of some of the best CFD trading brokers to check out.