


The S&P 500 Downtrend: What You Need To Know
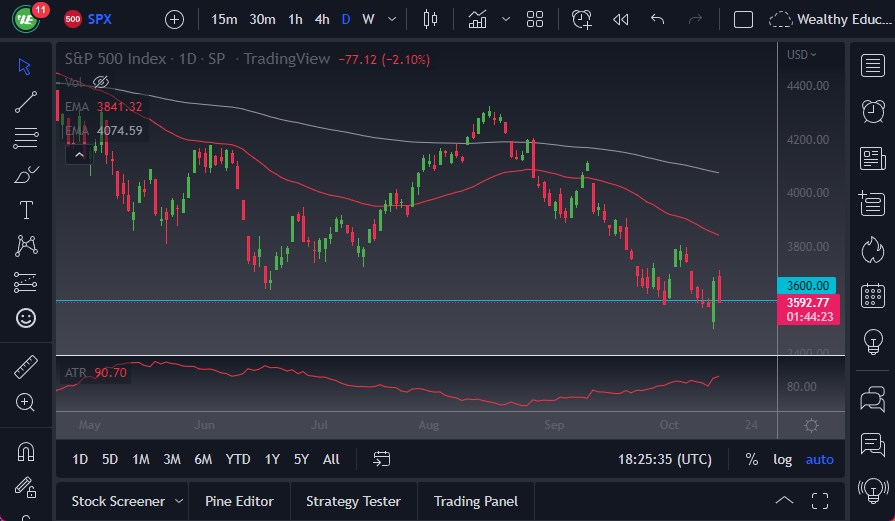
The S&P 500 Index has broken down significantly during the trading session on Friday, to take back about half of the gains from the previous session. At this point, the market looks as if it is ready to continue the overall downtrend, which makes quite a bit of sense considering that nothing is truly changed. Most of the buying that we had seen after the CPI number on Thursday was of the short covering variety, and quite frankly I would not read too much into it. Yes, it could easily have kicked off some type of rally, but the rally is still within the context of a larger downtrend.
Earning Season Breakdown Scenario
- If we break down below the bottom of the candlestick from the Thursday session, then it’s possible that we could go down to the 3500 level, followed by the 3400 level.
- We are in a downtrend, and as we head into earnings season it does make quite a bit of sense that we will continue to see negative momentum, because even though the major banks reported better than expected earnings during the Friday morning, the reality is that the market could not keep any momentum.
- This tells you everything you need to know, because even with good news, we can’t rally.
You also should keep an eye on forward expectations of CEOs and major corporations, because they are all saying the same thing, that they are extremely fearful at the moment. If that’s going to be the case, there is no real good news coming for the stock market, and at this point in time, I believe that any rally that we get will end up being a selling opportunity again.
The 50-Day EMA sits above the 3800 level and is dropping significantly. The 3800 level has been resistance previously, so at this point in time I think this is going to be a “ceiling in the market” that we can pay close attention to. If we broke above there, it would obviously be a major shift in attitude, but I just don’t see how that happens without some type of twist coming from the Federal Reserve. Monetary tightening continues to increase, as inflation has been far too hot for the Federal Reserve to not do something. At this point, Fed fund futures are anticipating 140 basis points of tightening between now and the end of the year.
Ready to trade the S&P 500 Forex? We’ve shortlisted the best Forex brokers for CFD trading in the industry for you.