


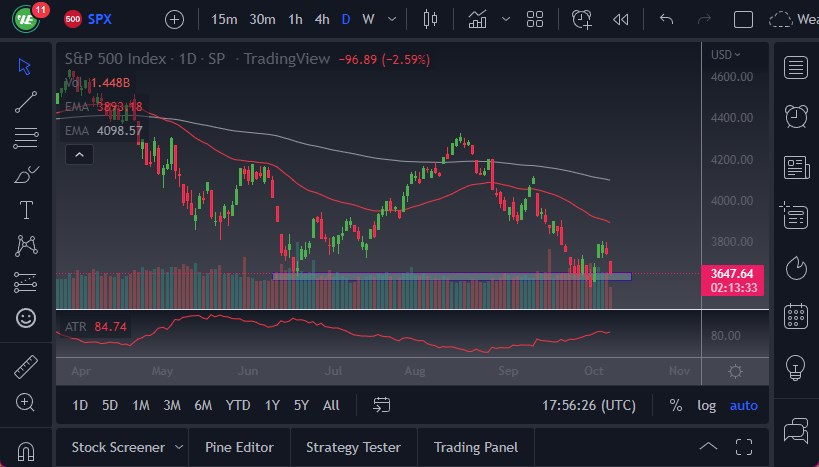
- The S&P 500 Index has fallen quite a bit during the trading session on Friday, gapping lower and then shooting straight down after the jobs never came out about as expected.
- It signals that the Federal Reserve is almost certainly going to raise 75 basis points at the next meeting.
- This is bad for the market, and therefore the reaction makes quite a bit of sense.
Selling Pressure Continues
The market looks like it is going to head toward the 3600 level, as the selling pressure seems to be relentless. Ultimately, I do think that we break down below there, and go down to the 3500 level. The S&P 500 is suffering at the hands of what’s going to be higher interest rates and of course the strengthening US dollar, as well as a significant amount of problems around the world when it comes to global growth. If there is no global growth, then obviously corporate profits are going to take a bit of a beating. In that scenario, I think that you continue to look at this as a “sell the rally” type of situation with the 3800 level above offers a significant amount of resistance.
The 50-Day EMA sits at the 3900 level and is dropping, so I think it makes a certain amount of sense that people would be paying attention to that as well, assuming that we were to try to rally. The market will look at the 50-Day EMA as dynamic resistance, as it typically does over the longer term. If we get anywhere near there and for some type of exhaustion candle I think that a lot of people will be willing to start shortening. The interest rates rising over the course of time in the United States continues to work against the value of stocks, and I think that’s the main play between now and the end of the year.
As the United States is almost certainly going to head into a recession, it does make a certain amount of sense that the stock market follows right along with negativity. The size of the candlestick is somewhat telling, and the fact that we are closing toward the very bottom of the range suggests that we have further to go as well. The attitude of the market remains very sour.
Ready to trade the Forex S&P 500? We’ve made a list of the best online CFD trading brokers worth trading with.