


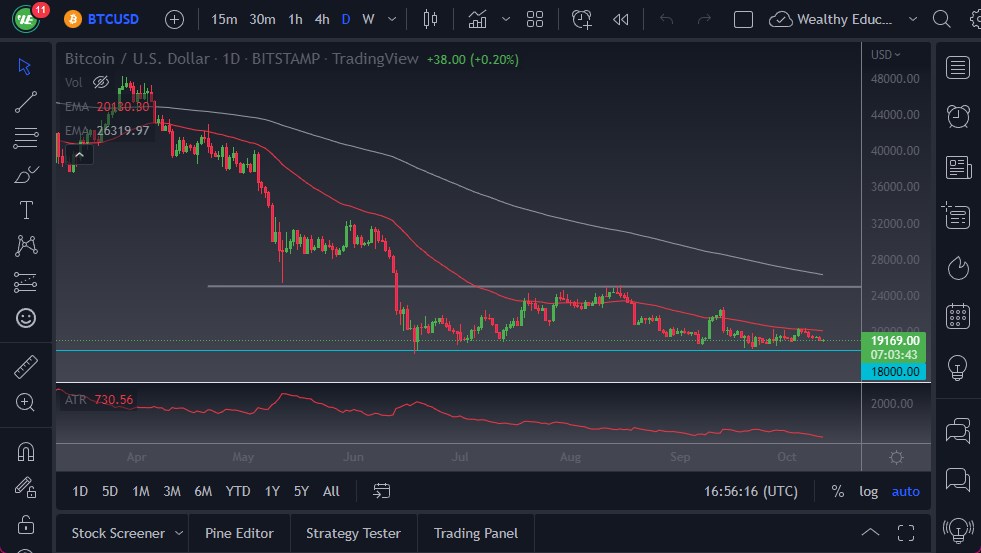
The BTC/USD has drifted back and forth during the session, doing almost nothing. In fact, by the end of the US trading session, we were up just 0.05%, in what had been extraordinarily quiet trading. The $18,000 level underneath should be a significant level that’s worth paying attention to, as it is a large, round, psychologically significant figure, and an area where we’ve already seen buyers’ step in and try to support the market.
If we were to break down below the $18,000 level, and I do think it happen sooner or later, then it opens the possibility of the market dropping down to the $15,000 level. The $15,000 level is an area that would have a lot of psychology attached to it, but the real support is probably going to be found closer to the $12,000 level. The significance of the $12,000 level is that it’s where the last bull market started, so would be a complete “round-trip” for those who got long on the breakout. One would have to think that there is a lot of “market memory” in that area, and therefore a significant amount of support.
Looking Toward the $25,000 Level
- In the case of a rally, the 50-Day EMA above could be difficult to clear, but if we do break above their week would more likely than not go looking toward the $25,000 level.
- The $25,000 level is a large, round, psychologically significant figure and an area that has been impossible to break above during the last 5 or 6 months.
- The 200-Day EMA sits in the same neighborhood, so that also gives it a little bit more staying power as far as resistance is concerned.
- If the market were to break above that level, then you could have an argument for a bullish market starting again, but quite frankly the odds of that are very slim to say the least.
In a twist of irony, the Bitcoin market desperately needs the Federal Reserve to step in and start flooding the markets with liquidity again, which is a lot of what made the market go higher in the first place. The ironic part about this of course is the fact that Bitcoin is supposed to operate outside of the traditional financial world. Over the last several months, we have clearly seen that it has not been able to do so.
 Ready to trade our Bitcoin trading forecast online? Here are the best MT4 crypto brokers to choose from.