


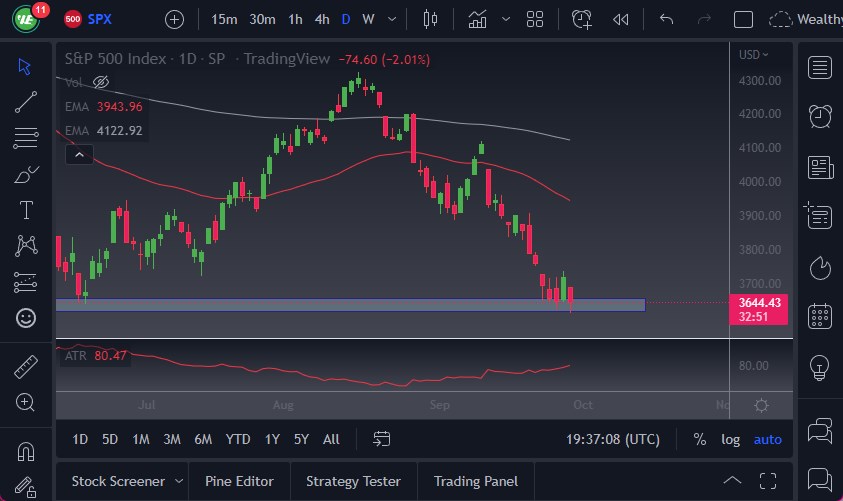
- The S&P 500 E-mini contract fell during the trading session on Thursday, as we continue to test the crucial 3600 level.
- The 3600 level is an area where we could continue to see a bit of support, so if we were to break down below there it would obviously be very negative.
- At that point in time, the market is likely to go down to the 3500 level.
Any rally now will more likely than not see a significant amount of selling pressure above, especially near the 3700 level, and then again maybe at the 3800 level. Ultimately, that is an area where I think a lot of people would be looking for even more downward pressure. Keep in mind that the Federal Reserve continues to see a lot of tightening in its future, so therefore it’s likely that we have a situation where the S&P 500 will eventually drop.
Resistance Barrier Ahead
Keep in mind that the 50-Day EMA is below the 4000 level now, and therefore it’s likely that we will continue to see that as a major resistance barrier, and therefore it’s likely that anything above there would turn the market around completely, but I just don’t see how that happens in this environment, but I suppose it’s always a possibility. The market has been consolidating for a while, which is typically what happens right before you get some type of punch through either support or resistance, but in this case, we would be talking about support.
If the market were to go down to the 3500 level, that could kick off another major fight, and obviously breaking down below that level would be a huge turn of events and could lead to a huge crash in the stock market. I do believe that it is probably only a matter of time before we would see an acceleration to the downside. Ultimately, I think this is a situation where things would be tenuous at best, but as we head into the weekend it’ll be interesting to see how the market closes because where traders are willing to set their positions heading into the weekend tells you a lot about how they think and feel about the market. I believe that by the time we get through the Friday session, a lot of questions can be answered.
Ready to trade our S&P 500 daily forecast? Here’s a list of some of the best CFD trading brokers to check out.