


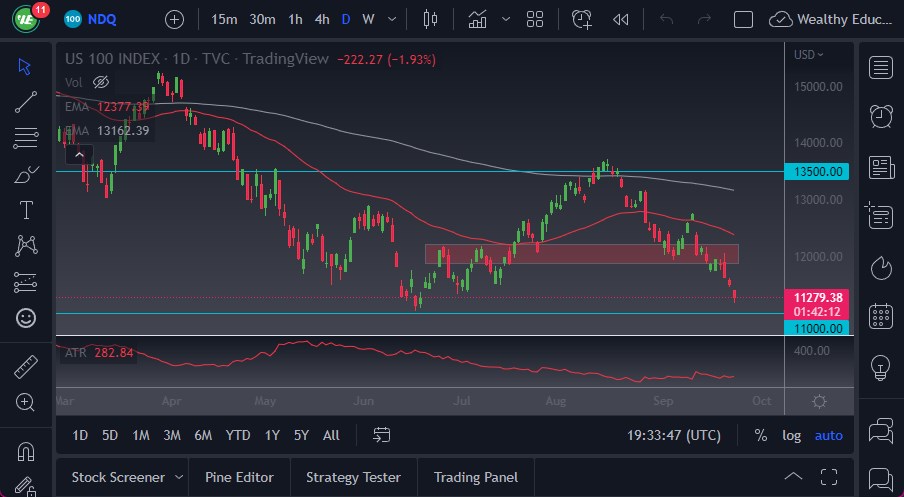
- The NASDAQ 100 index has broken down significantly during the trading session on Friday as it looks like we are going to continue to see a lot of negativity.
- The market is likely to continue seeing the 11,000 level underneath as a major support level. If we do break down below there, then it could really start to fall apart, opening up the possibility of a real selloff.
- I do think that happens given enough time, but markets don’t move in one direction forever.
Short Covering Rally Ahead
As we are getting close to the end of the session, it is likely that we will continue to see a little bit of a short covering rally, as we try to stabilize. Nonetheless, this is a market that still has a lot of negativity on it, and I think that the interest rates rising in America will continue to be a major issue. Furthermore, the NASDAQ 100 is only driven by a handful of companies, so you have to pay attention to all the usual suspects such as Tesla, Amazon, Microsoft, etc.
The 12,000 level should be a significant barrier, assuming that we bounce that far. Quite frankly, until the interest rate market slows down, it’s very likely that we will continue to see stocks fall. The market breaking down below the 11,000 level would open up a move down to the 10,500 level, and then possibly the 10,000 level after that. The market will more likely than not see a lot of psychological support in that area, but if we drop down to that area, it’s a loss of another 10% and it would cause some major problems. In that scenario, I think you have a situation where the NASDAQ plunges right along with many of the other indices around the world.
Regardless, I think the biggest thing you need to pay attention to is going to be the volatility and therefore it’s likely that you need to keep your position size reasonable. We are overdone to the downside, so I would like to see some type of exhaustion after a bounce to start shorting again. I have no interest whatsoever in trying to buy this market, quite frankly I think it is going to continue to be a very negative market, but you do have the occasional “bear market rally” along the way.
Ready to trade our NASDAQ 100 Index forecast? Here are the best CFD brokers to choose from.