


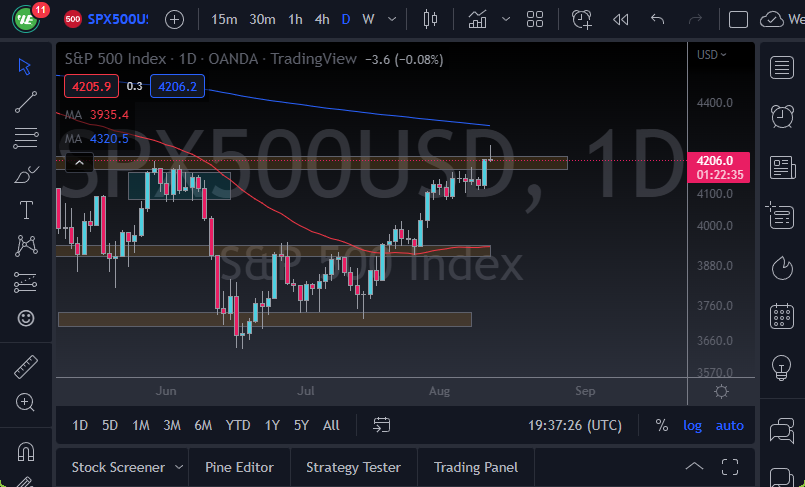
- The S&P 500 index rallied a bit during the trading session on Thursday but gave back gains rather quickly.
- This is a market that looks like it is running into a bit of overextension, and the fact that we did up forming a bit of a shooting star should not be a huge surprise considering that the market shot straight up in the air after the “surprise” CPI number.
- Now that the children are out of the way, cooler heads have prevailed, which is quite often the case during these announcements.
Ultimately, the CPI numbers coming out the way they did were cooler than anticipated, but the reality is that the inflation numbers in the United States are far too high to think that the Federal Reserve is going to slow down. In fact, they have been telling anybody that will listen to them that they are in fact going to continue to see reasons to hike rates. Because of this, it’s very unlikely that the stock market can simply go straight up in the air from here. Furthermore, we are heading toward the weekend, so the Friday close could tell us a lot about how people feel about holding on to risk assets.
With that being said, would not surprise me at all to see a little bit of a pullback at this point, perhaps reaching toward the bottom of the candle from the Thursday session. If we blow through that, then it’s likely that the market goes much lower, perhaps reaching down to the 4000 level. I do not think this market simply melts down, but the reality is that the economic situation has not changed whatsoever, so I’m not overly concerned about trying to get long at this point.
If we do break to the upside, then we would need to deal with the 200 Day EMA, which has a lot of psychology attached to it. We also have the 4300 level, which is a major resistance barrier, so that would take quite a bit of effort to get through. If we do that, then I think we have a longer-term “buy-and-hold” type of situation ahead of us. That seems to be very unlikely at this point though, simply due to the fact that we have so many crosscurrents out there.
Ready to trade our S&P 500 daily forecast? Here are the best CFD brokers to choose from.