So, when starting the week, it is a good idea to look at the big picture of what is developing in the market as a whole, and how such developments and affected by macro fundamentals, technical factors, and market sentiment. Read on to get my weekly analysis below.
Fundamental Analysis & Market Sentiment
I wrote in my previous piece on 21st August that the best trades for the week were likely to be:
- Short of the GBP/USD currency pair, which fell by 0.75%.
- Long of Natural Gas, which rose by 1.04%.
This produced an average win of 0.90%.
The news is currently dominated by the Federal Reserve Chair Jerome Powell’s speech on Friday, which was received negatively by markets. Powell stated that inflation was still too high, too persistent, and too dangerous as a driver of long-term expectations to be met with anything other than tough monetary measures as part of a struggle to drive it down. Powell said this would necessarily cause some pain to the economy and he signaled there is no chance of a dovish pivot which some analysts had been hoping for after recent inflation data suggested that CPI has already peaked in the USA. Powell’s speech at the Jackson Hole symposium sent stock markets sharply lower, and hit risk sentiment hard, which sent money flowing into the US Dollar in the Forex market and out of riskier currencies such as the British Pound, the Euro, and the commodity currencies.
A 0.50% rate hike at the Fed’s next meeting is all but certain, while analysts now see a real chance of a 0.75% as an alternate possibility.
It is worth pointing out that although the US stock market had been rising in recent week, the US stock market has technically been in a bear market for some time, with the US yield curve being inverted for several weeks now. The US is also arguably in a recession, having seen two successive quarters of GDP contraction, although wages growth and the job market remain relatively buoyant. The case for recession was boosted by data released last week which showed that in Q2 2022, US GDP shrunk at an annualized rate of -0.6%.
To recap there were two other important economic data releases last week apart from the US Preliminary GDP data. The results were as follows:
- US Core PCI Price Index data – the month-on-month increase was only 0.1%, lower than the 0.2% which had been expected, slightly boosting hopes that US inflation has already peaked.
- US, UK, German, and French Flash PMI data – the results were mixed, but overall, more negative than had been expected, suggesting there may be a slowing in producer output in the EU, the UK, and the USA.
The Forex market saw a rise by the Australian and US Dollars last week. The rise was broad but especially strong against the New Zealand Dollar.
Rates of coronavirus infection globally dropped last week for the sixth consecutive week. The most significant growths in new confirmed coronavirus cases overall right now are happening in Japan, South Korea, Russia, and Taiwan.
The Week Ahead: 29th August – 2nd September 2022
The coming week in the markets is likely to show a slightly higher level of volatility than last week, with Friday’s higher level of market activity following Powell’s speech likely to continue. Releases due are, in order of likely importance:
- US Non-Farm Payrolls, Average Hourly Earnings, and Unemployment data (plus the earlier forecast)
- German Preliminary CPI data
- US JOLTS Job Openings data
- US CB Consumer Confidence
- US ISM Manufacturing PMI data
- Swiss CPI (inflation) data
Technical Analysis
U.S. Dollar Index
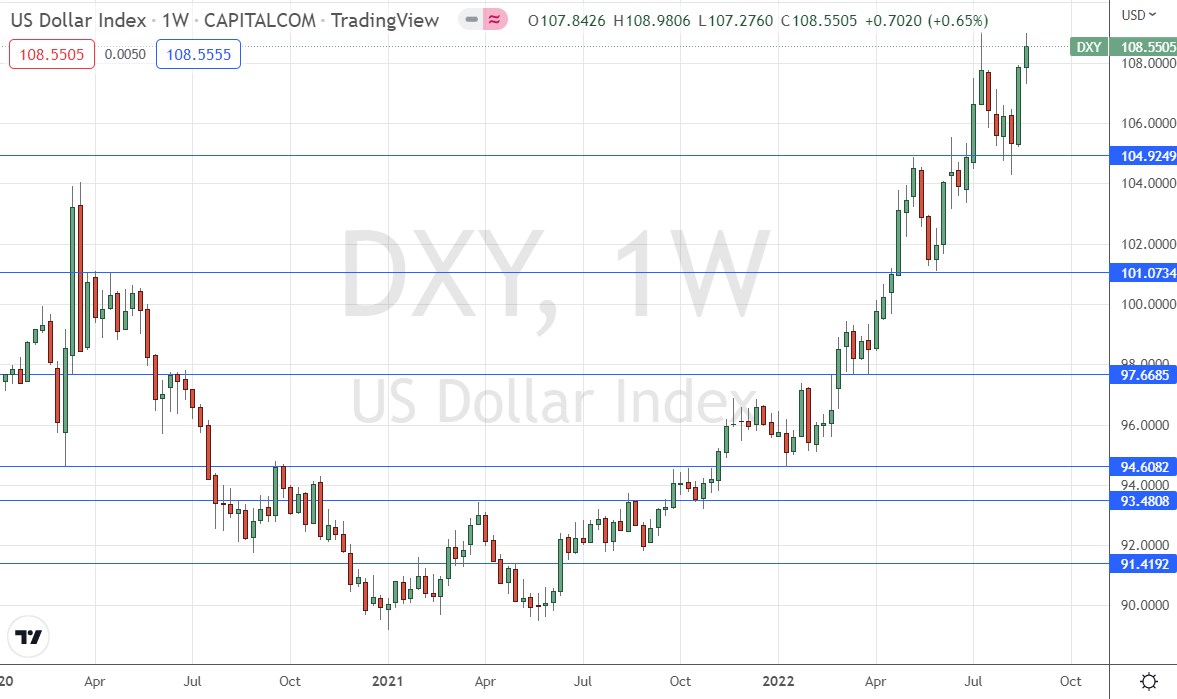
The weekly price chart below shows the U.S. Dollar Index printed a bullish candlestick which closed up, in line with the long-term trend, which is bullish. The weekly closing price is a 20-year high, and the week’s rise came after the price rejected the support level below just under 105.00 a few weeks ago. These are all bullish signs, and with the chair of the Fed giving a very hawkish speech a few days ago about the need for more rate hikes to fight US inflation, the bullish technical picture is supported by sentiment and monetary policy fundamentals.
It will probably be a good idea to look for long trades in the US Dollar over the coming week. This is a very powerful, long-term bullish trend in the most important currency in the Forex market, and it remains likely to continue if sentiment remains driven by the fear of ongoing interest rate hikes negatively impacting risky assets, with the US Dollar acting as a primary safe haven.
EUR/USD
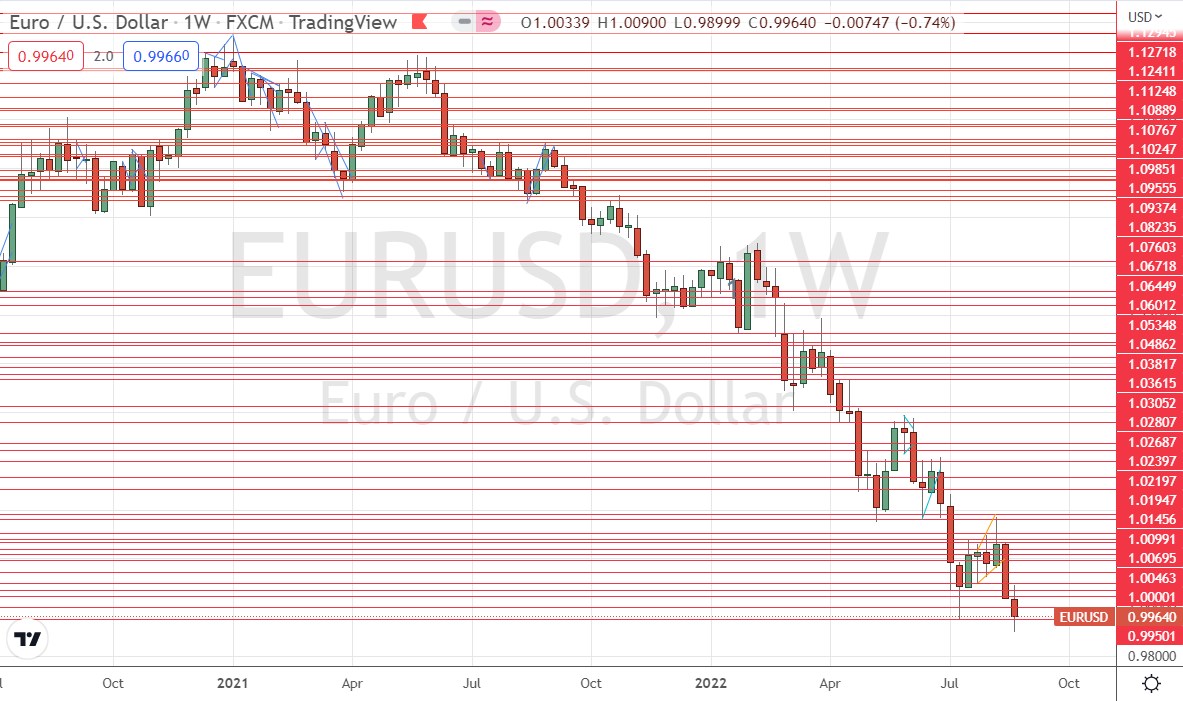
Last week saw the EUR/USD currency pair print a bearish candlestick. This pair is technically interesting as it again printed the lowest weekly close seen in almost 20 years.
The Euro is beset by worry over the impact of ECB rate hikes which have begun and must continue. These hikes are going to put a severe strain on government bond markets in southern Europe, notably Italy.
The strength of the US Dollar and the technical breakdown we see here, plus fundamental headwinds against the Euro, see a short trend trade opportunity continue in this currency pair. However, it is probably helpful to use relatively wide trailing stop losses for this pair, as using ATR 3 has over the years produced better results than ATR 1.
GBP/USD
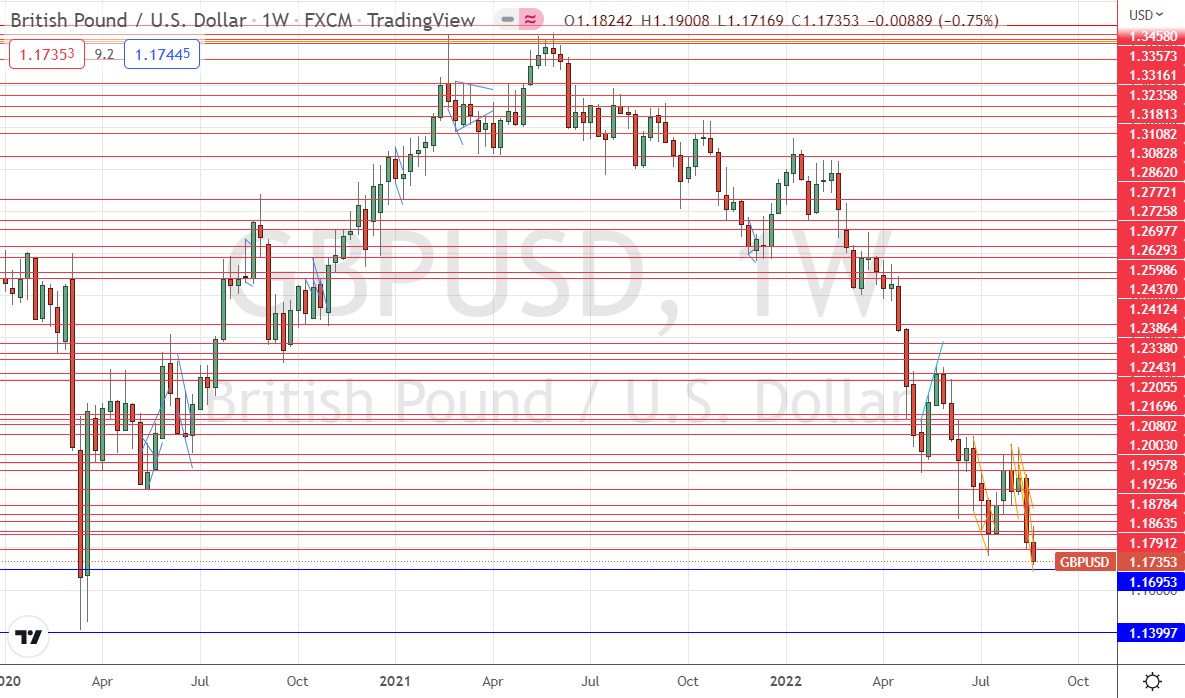
Last week saw the GBP/USD currency pair print a bearish candlestick. This pair is technically interesting as it printed the lowest weekly close seen since the coronavirus panic in March 2020.
The British Pound is troubled by fundamental woes, including new increased inflation figures above 10%, and a Bank of England forecast of a coming recession which will last for five quarters and see GDP shrink by 2.2%.
The strength of the US Dollar and the technical breakdown we see here, plus fundamental headwinds against the Pound, see a short trend trade opportunity continue in this currency pair. However, it is important to use relatively tight trailing stop losses for the British Pound, as using ATR 1 has over the years produced much better results than the more typical ATR 3.
NZD/USD
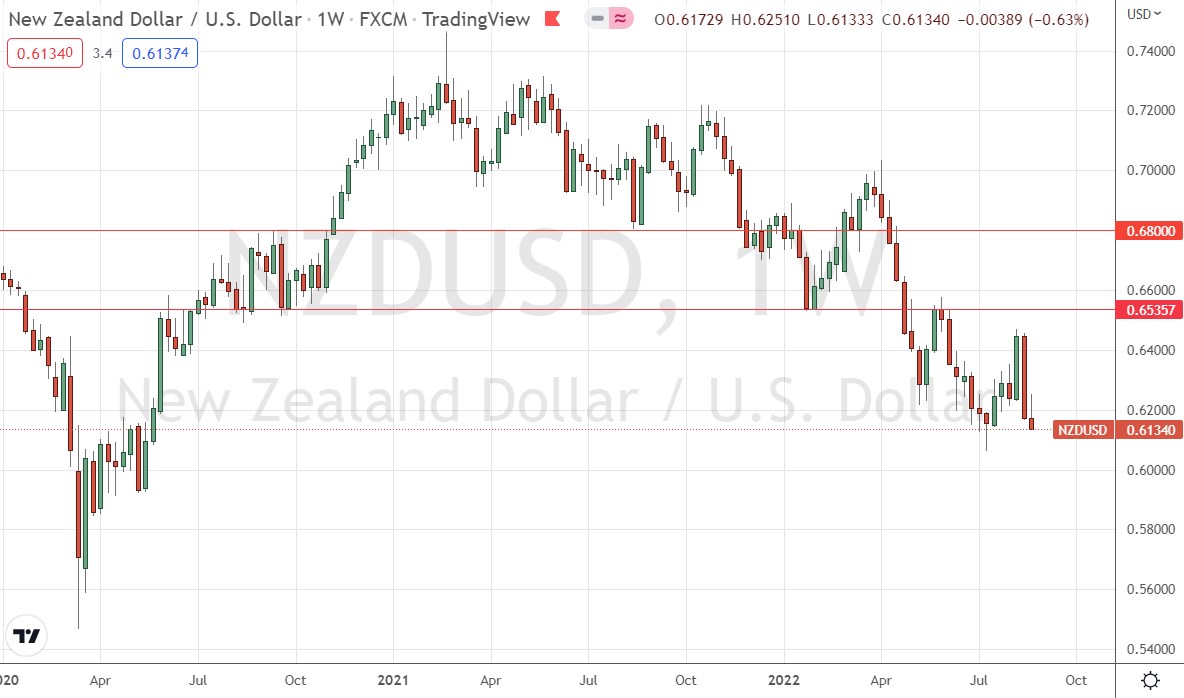
The New Zealand Dollar was the biggest loser of all major currencies last week, despite the RBNZ’s rate hike two weeks ago by 0.50% to 3.00%, the highest rate of any major currency. We finally see a technical breakdown below recent support here, with the price making its lowest weekly close since May 2020.
It is notable that the price closed right on the low of the week, which is a bearish sign.
There may be further bearish momentum in the NZD/USD currency pair over the coming week, with the NZD the weakest of all major currencies suggesting that this can be an interesting currency on the short side.
Natural Gas
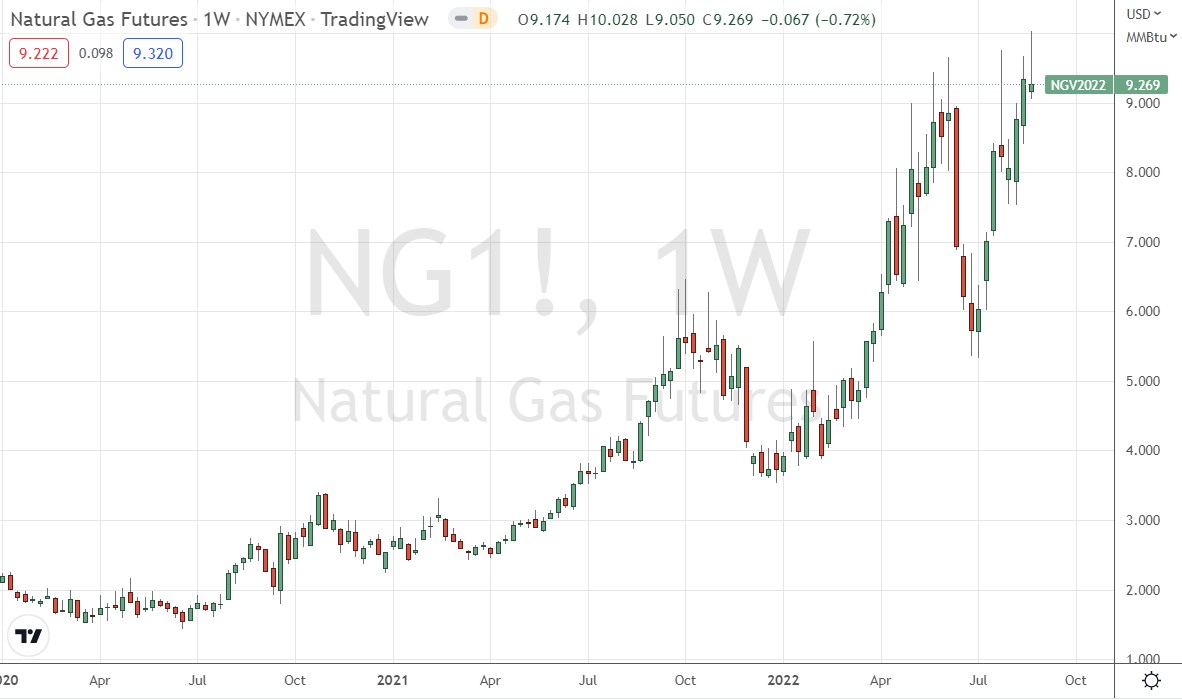
Although we are seeing a bearish market with most commodities and risky assets shrinking against safe havens such as the US Dollar, we have seen Natural Gas gain very slightly over the past week to make new multi-year highs.
Volatility is very high and price movement can be extremely choppy.
Long natural gas can be an attractive trend trade as we are seeing a breakout in the price chart. However, anyone trading natural gas should be very, very mindful of the extremely high level of volatility we have seen here over recent months, and trade very small position sizes which respect the volatility.
What is even more concerning for anyone thinking of going long here is the fact that we see the current weekly candlestick form as an inverted bearish hammer, which hints that there may not be much upside left over the near term.
As commodities in general and energies are quite weak, I do not have strong faith in a long trade here, which is another reason to keep the position size very small if you are trading natural gas over the coming week.
Bottom Line
I see the best opportunities in the financial markets this week as likely to be short of the EUR/USD, GBP/USD, and NZD/USD currency pairs.
Ready to trade our Forex weekly forecast? Here’s a list of some of the best Forex trading platforms to check out.
