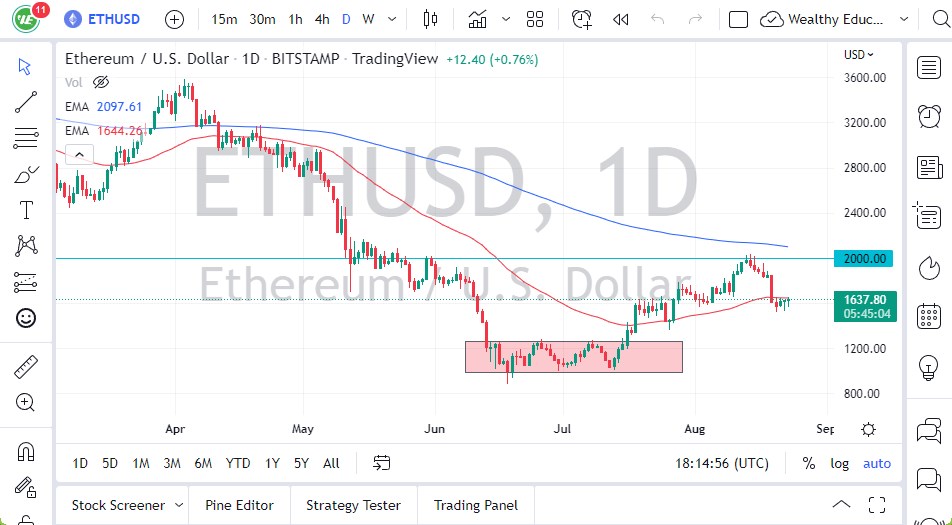
The ETH/USD has gone back and forth during the trading session on Tuesday as we continue to trace the 50 Day EMA. The 50 Day EMA is an indicator that a lot of people pay attention to, so it’s not overly surprising to see that the market is just simply hanging around this area. Furthermore, the $1600 level is an area that has been important more than once, so it’s not overly surprising that we are hanging around.
Looking at this chart, it appears that we are finding short-term buyers on small dips, but it does not necessarily mean that we are ready to take off to the upside. The market is going to continue to see a lot of concerns, because quite frankly the risk appetite globally is anemic, to say the least. Furthermore, you also have to keep in mind that Ethereum is pretty far out on that risk spectrum. In other words, the market needs to see a lot of confidence in order to truly take off.
Waiting for Stocks to Take Off
- If we were to break above the 50 Day EMA, then it’s likely that we could open up a move to the $2000 level. The $2000 level of course is a large, round, psychologically significant figure, and sitting just below the 200 Day EMA.
- The market is going to look at that as a major ceiling in the market, so we need to break above there before we could take off to the upside.
- At that point, we could see a significant “buy-and-hold” type of move at that point.
On the other hand, if we break down below the $1500 level, it’s likely that the market could go down to the $1200 level. In that area, you would expect to see a lot of support considering that it was the top of a consolidation area that so many people had been paying attention to as marked on the chart. Breaking below there then opened up a much deeper correction.
Although cryptocurrency is supposed to be its own asset, it has a lot of correlations. Stock markets have huge correlations to cryptocurrency, and therefore you need to see stocks truly take off to see Ethereum take off. It has not decoupled from the traditional market check, despite the fact that “The Merge” is coming.
Ready to trade our ETH/USD forecast? We’ve made a list of the best crypto brokers worth trading with.

