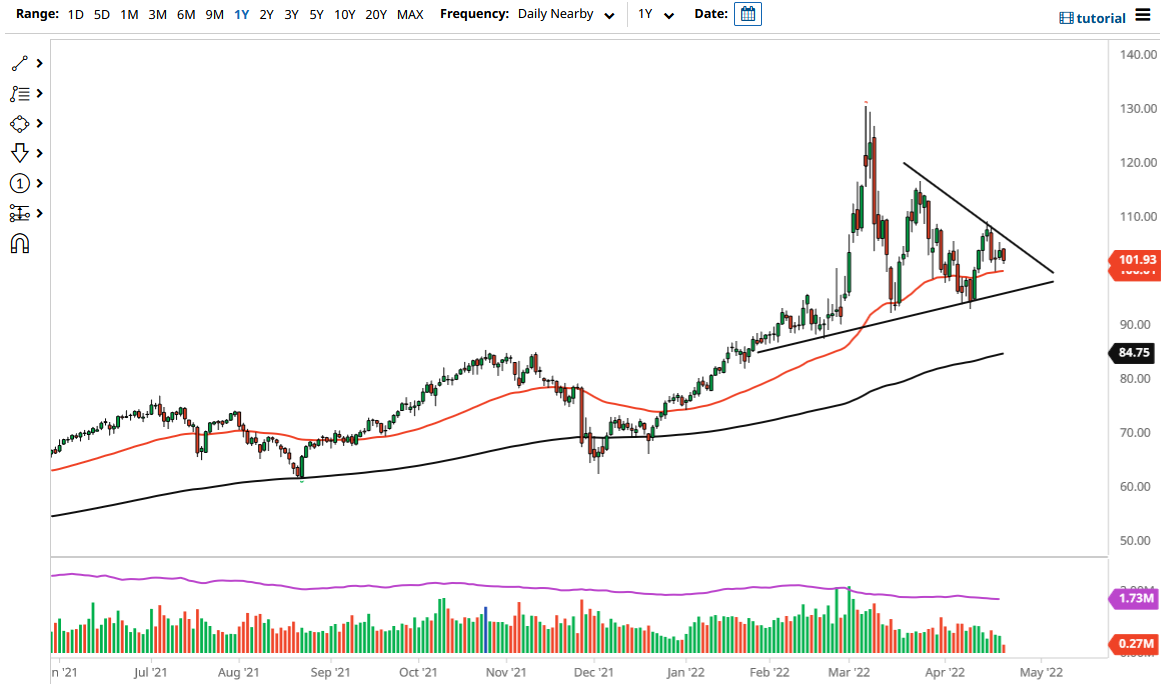
The West Texas Intermediate Crude Oil market fell a bit on Friday as we continue to see a lot of back-and-forth trading. This suggests that perhaps the market is going to continue to grind around and try to figure out where to go next. When markets impress like this, it is very likely that you are going to see a huge move in one direction or the other. The 50-day EMA is sitting just below, and that is an area that a lot of people would be paying close attention to.
Just above, you have a huge downtrend line that comes into the picture, but that is going to be a short-term resistance barrier. At this point, if you see the market break above there, then we could have a run to reach the $110 level rather quickly. The $110 level is a large, round, psychologically significant level, and an area where we have already seen sellers jump back into the market. While we have not made it to break out to that area yet, it would not be overly surprising considering that the most recent low seems to be held up by the 50-day EMA.
The alternate scenario is that the market breaks down below the 50-day EMA, which is essentially the same thing as the $100 level. By breaking down below the $100 level, it opens up the possibility of a move down to the uptrend line that I have marked on the chart. That is your last line of defense for the buyers, and think that the oil market will go looking to the $90 level rather quickly. After that, then you could threaten the 200-day EMA which is roughly $5 below there.
You can see that we have been coiling for some time, so the next move that we get should be rather explosive in one direction or another. That being said, the market seems to be taking its sweet time to get there. When you look at this chart, you can see that choppiness continues to be a major issue, so you are more likely than not going to need to trade shorter-term charts more than anything else. I would be very cautious about jumping “all in” right away.

