The difference between success and failure in Forex trading is very likely to depend mostly upon which currency pairs you choose to trade each week and in which direction, and not on the exact trading methods you might use to determine trade entries and exits.
When starting the trading week, it is a good idea to look at the big picture of what is developing in the market as a whole and how such developments and affected by macro fundamentals and market sentiment.
There are a few strong trends in the markets, so it is an interesting time to be trading.
Fundamental Analysis & Market Sentiment
I wrote in my previous piece last week that the best trade for the week was likely to be long of USD/JPY, following a daily (New York) close above ¥123.12. This was a good call as USD/JPY rose by 0.54% after closing Tuesday at ¥123.60.
The news remains dominated by the Russian invasion of Ukraine which is now well into its seventh week. Russian forces have withdrawn from the northern part of the company, switching focus to the south and east of Ukraine. However, the war no longer seems to be having much impact on markets, beyond helping to keep the prices of some agricultural commodities such as corn buoyant.
Markets have shifted more into a risk-off mode over the past week, with almost all major stock markets ending the week lower, while the US Dollar strengthens, and the Japanese Yen weakens. Certain agricultural commodities are also reaching or close to long-term highs. This can probably be explained by three factors:
The war in Ukraine still triggers anxiety and has a potential to escalate, although this seems increasingly unlikely.
Inflation continues to register at higher-than-expected levels in more developed economies, except for Japan, pushing most central banks towards more hawkish policies, except for the Bank of Japan.
The FOMC meeting minutes released last week show that the Federal Reserve came close to hiking rates last month by 0.50%, double the 0.25% hike which was implemented, and is pushing a strong target of shrinking its balance sheet by up to $95 billion per month. This represented a minor hawkish tilt.
In other news last week:
The 2- and 10-year US Treasury yield curve inversion corrected itself last week, after inverting for the first time since 2006. Such a yield inversion is traditionally seen as an indicator of an impending recession, so is usually negative for stock markets. However, most analysts do not see this as a likely outcome currently.
The Reserve Bank of Australia released its monthly Rate Statement after keeping its Cash Rate at 0.10%, in which the Bank took a more hawkish tilt removing accommodative policy language, pointing towards a likely rate hike in June 2022. The Australian Dollar responded by rising to reach a new 9-month high price.
The Bank of Japan continued to encourage a weaker Yen, with Governor Kuroda stating that although the recent Yen weakening was “somewhat rapid”, further weakness in the Yen would be positive for the Japanese economy. A maximum figure of ¥130 for USD/JPY has been indicated by the Bank.
Canadian employment data came in almost as expected, showing a decrease to an unemployment rate of 5.3%.
Last week saw the global number of confirmed new coronavirus cases decline for the third consecutive week. Approximately 64.7% of the global population has now received at least one vaccination, and 6.3% are known to have contracted the virus.
The strongest growths in new confirmed coronavirus cases overall right now are happening in Barbados, Bhutan, China, and Taiwan.
The Week Ahead: 11th – 15th April 2022
The coming week in the markets is likely to be volatile as there are many data releases of high importance scheduled, including from three central banks. They are, in order of probable importance:
US CPI (Inflation)
ECB Main Refinancing Rate and Monetary Policy Statement
UK CPI (inflation)
RBNZD Cash Rate and Rate Statement
BoC Rate Statement, Overnight Rate, and Monetary Policy Report
US PPI
Australian Unemployment
US Retail Sales
Technical Analysis
U.S. Dollar Index
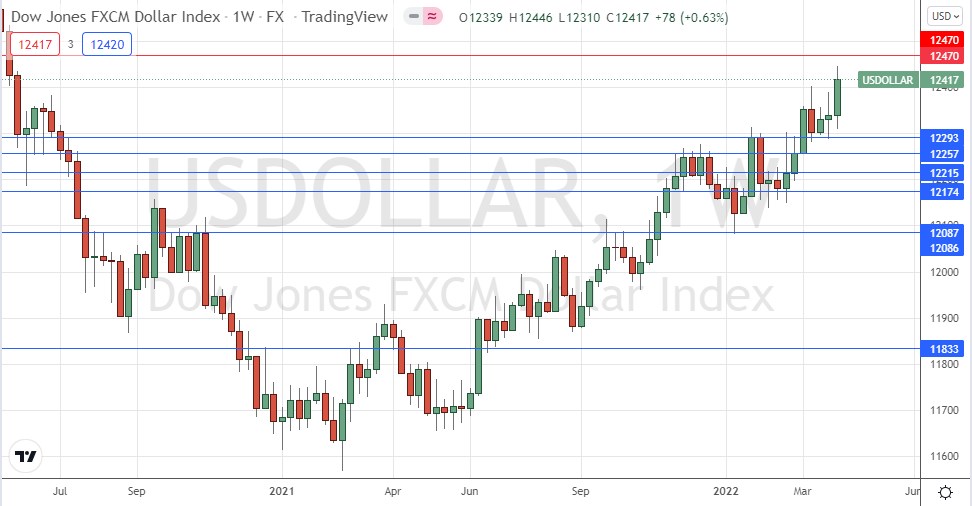
The weekly price chart below shows the U.S. Dollar Index rose strongly last week, in line with the long-term bullish trend, printing a bullish candlestick that closed in the top quarter of its range. This was the highest weekly close seen since May 2020. The low of the weekly candlestick was not far from the support level at 12293. Dollar bulls will be encouraged that the nearest support level, shown in blue at 12293 within the below price chart, has continued to hold, and the price has continued to advance to new highs. However, the price is not far from a key resistance level at 12470 which may impede further progress, at least over the short term.
It will probably be wise to take trades in favor of the US Dollar in the Forex market over the coming week.
S&P 500 Index
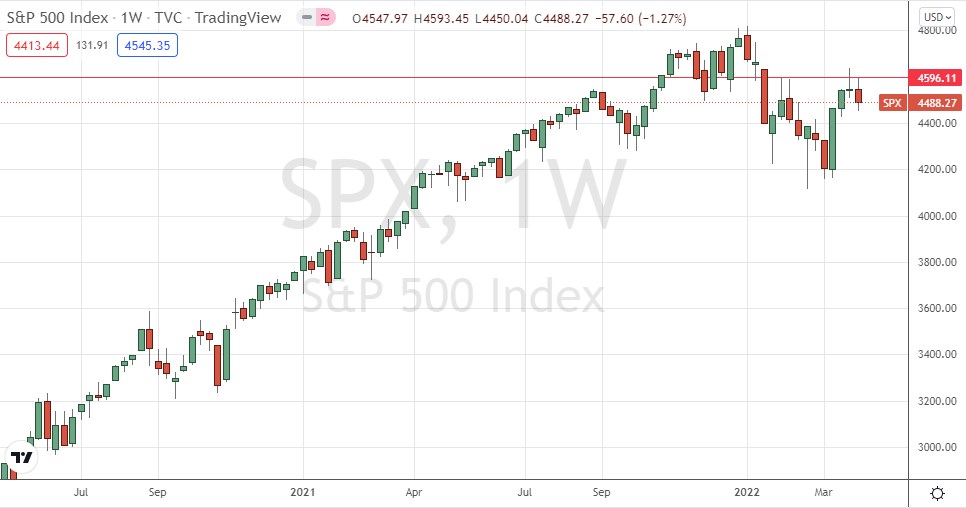
The world’s most important stock market index, the S&P 500, fell last week, after rejecting the resistance level at 4596 which I have been noting over recent weeks. One the daily chart, the price is again trading below its 200-day simple moving average. These are bearish signs. However, downwards momentum is not strong enough to make any short trade here an interesting prospect.
I see the US stock market as an uncertain trade right now due to signs of deteriorating consumer demand and a tightening monetary policy from the Federal Reserve.
USD/JPY
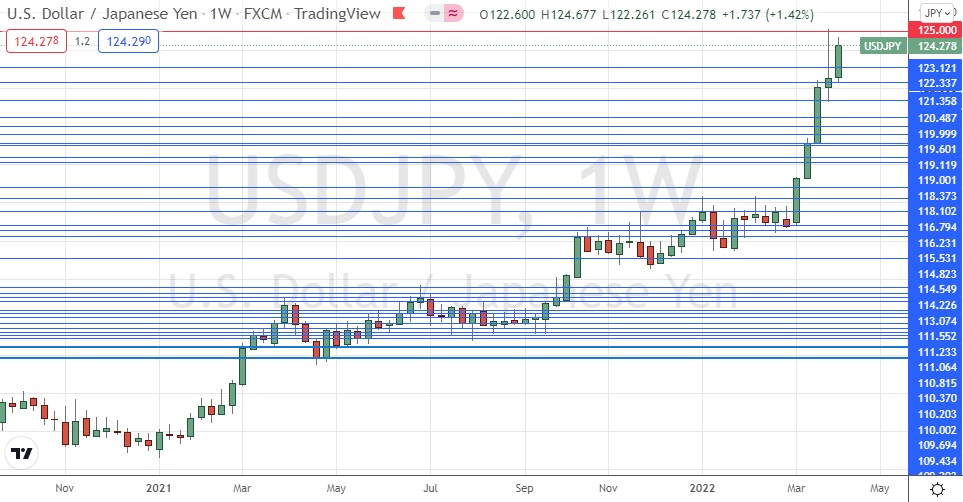
The USD/JPY rose very strongly over the past few weeks, eventually peaking the week before last at its highest closing price seen in over 6 years above ¥125. The past week saw the price rise again strongly, after making a significant retracement, although the price has not yet hit ¥125 for a second time. Last week’s closing price was the highest seen in more than 6 years.
There is a reason to keep looking to the bullish side after such a strong price movement and resumed bullish momentum, and public declarations from the Bank of Japan suggesting they could tolerate the price rising as high as ¥130 before intervening.
As the price got established above a key former resistance level at ¥123.12 last week, I am prepared to take a long bias on this currency pair right away.
10-YR US Treasury Yield
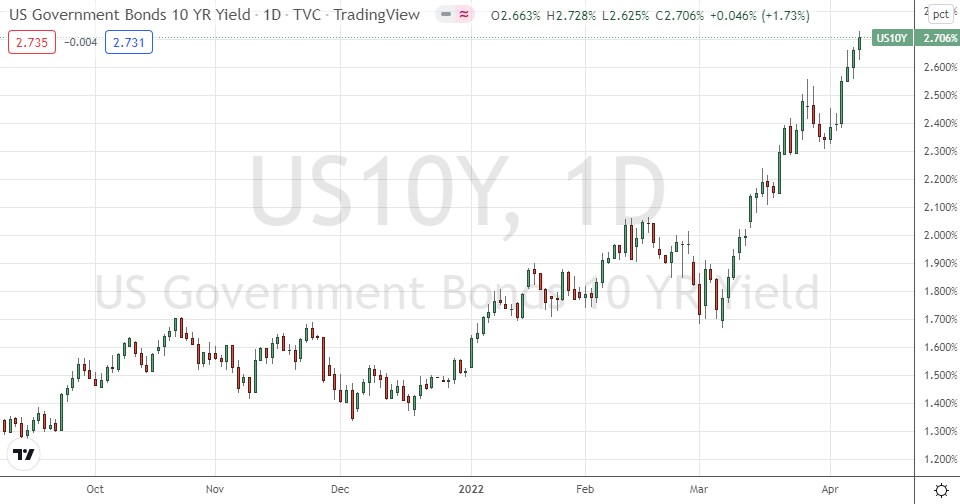
There has been much focus on US treasury yields lately, after the yield curve briefly inverted a couple of weeks ago, and as the Fed and other major central banks begin to take significant steps to tighten monetary policy.
The US Dollar is the strongest major currency right now, and this is partly because the yields on its treasury bills continue to climb to new highs.
The 10-year yield is increasing more strongly than the 2-year yield so the bullish momentum in treasury yields is here. This makes an attractive long trade if you have access to the right instrument to do it, such as a micro future or an ETF.
Sugar
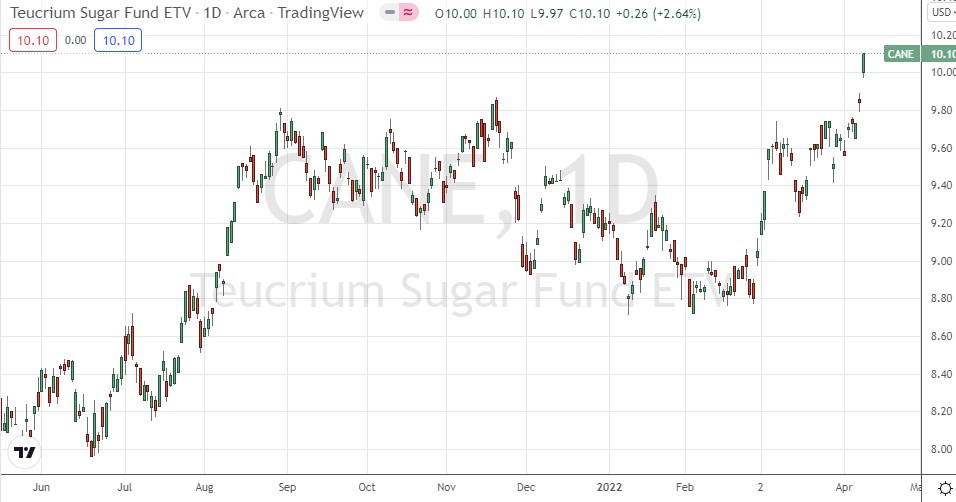
After making a consolidation over the past several months, the long-term upwards trend seems to have resumed with a strong breakout above the recent range. The daily price chart below shows a strong breakout candlestick which not only closed at the highest price seen in 5 years, but also closed right near the high of its range and above the big round number at $10. These are bullish signs, and for trend and breakout traders, in this era of rising commodity prices, it could be an interesting trade.
Corn
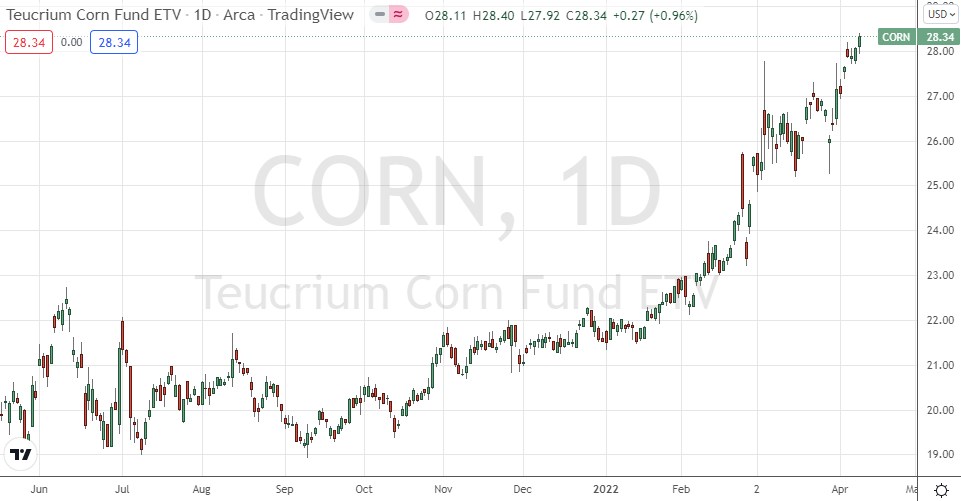
The price of corn has risen dramatically since 2022 began after consolidating over the second half of 2021. We have seen the price make a very strong push upwards that just keeps continuing, and the price of this basic foodstuff just keeps getting more and more expensive, driven partly by the ongoing war in Ukraine. We are in an era of high and rising commodity prices, partly spurred by historically high inflation levels as well as creaking supply chains.
The initial rise at the start of 2022 shown in the price chart below is a classic “cup and handle” Forex chart pattern, which can often indicate a coming strong price rise, as it seems to have done here.
There are great reasons to trade corn long, but it is not clear the price right now is at an optimal entry point. Some traders will prefer to wait for a bearish retracement followed by a resumption of the bullish trend before entering.
Bottom Line
I see the best opportunities in the financial markets this week as likely to be long of USD/JPY, the 10-Year US Treasury Yield, Sugar, and Corn.
