Bearish View
- Sell the BTC/USD pair and set a take-profit at 37,000.
- Add a stop-loss at 41,500.
- Timeline: 1-2 days.
Bullish View
- Set a buy-stop at 40,500 and a take-profit at 42,500.
- Add a stop-loss at 37,000.
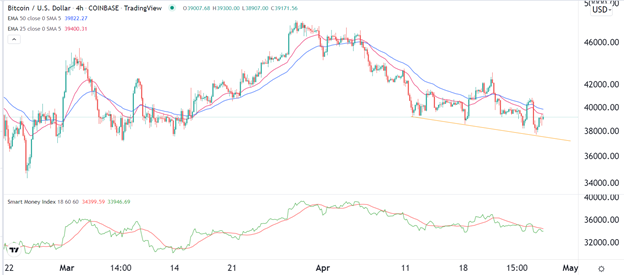
The BTC/USD pair remained in a tight range as Wall Street attempted to recover. The pair is trading at 39,220, which is slightly above this week’s low of 37,700. It has been in this range in the past few weeks.
Bitcoin and Stocks Correlation
The BTC/USD rebound happened as American stocks attempted to bounce back as the earnings season continued. The Dow Jones added over 430 points while the Nasdaq 100 index rose by more than 195 points. Some of the best performers were tech companies like Microsoft, Visa, and Mastercard.
In the past few months, the correlation of Bitcoin and stocks has been close. For example, Bitcoin has already dropped by about 18% from its highest level this month while Nasdaq 100 has fallen by over 13% in the same period.
Therefore, it can be assumed that the two assets are being driven by the same forces. The most likely catalyst is the change of tune by the Federal Reserve. The bank believes that more rate hikes are needed considering that inflation has surged to the highest level in over 40 years.
The Fed has also hinted that it will start implementing quantitative tightening (QT) in the coming months. This will involve reducing its balance sheet by about $75 billion per month.
Therefore, investors believe that stocks and digital currencies will underperform as the bank unwinds the policies it implemented during the pandemic.
At the same time, on-chain data shows that inflows in Bitcoin have been a bit low in the past few months. Instead, many small investors have used the recent rallies to take profits. Another key event that happened is that the first ETP to combine gold and Bitcoin launched on the SIX Swiss Exchange. The product aims to make BTC a more mainstream asset.
BTC/USD Forecast
The BTC/USD pair has been moving without a well-defined trend in the past few days. The pair remains slightly above the descending trendline shown in orange. It has also formed what looks like a slanted head and shoulders pattern. This pattern is usually a bearish signal. The pair is also below the 25-period and 50-period moving average while the Smart Money Index (SMI) has been moving sideways.
The pair will likely resume the downward trend in the near term. If this happens, the next key support to watch will be the psychological level of 37,000.

