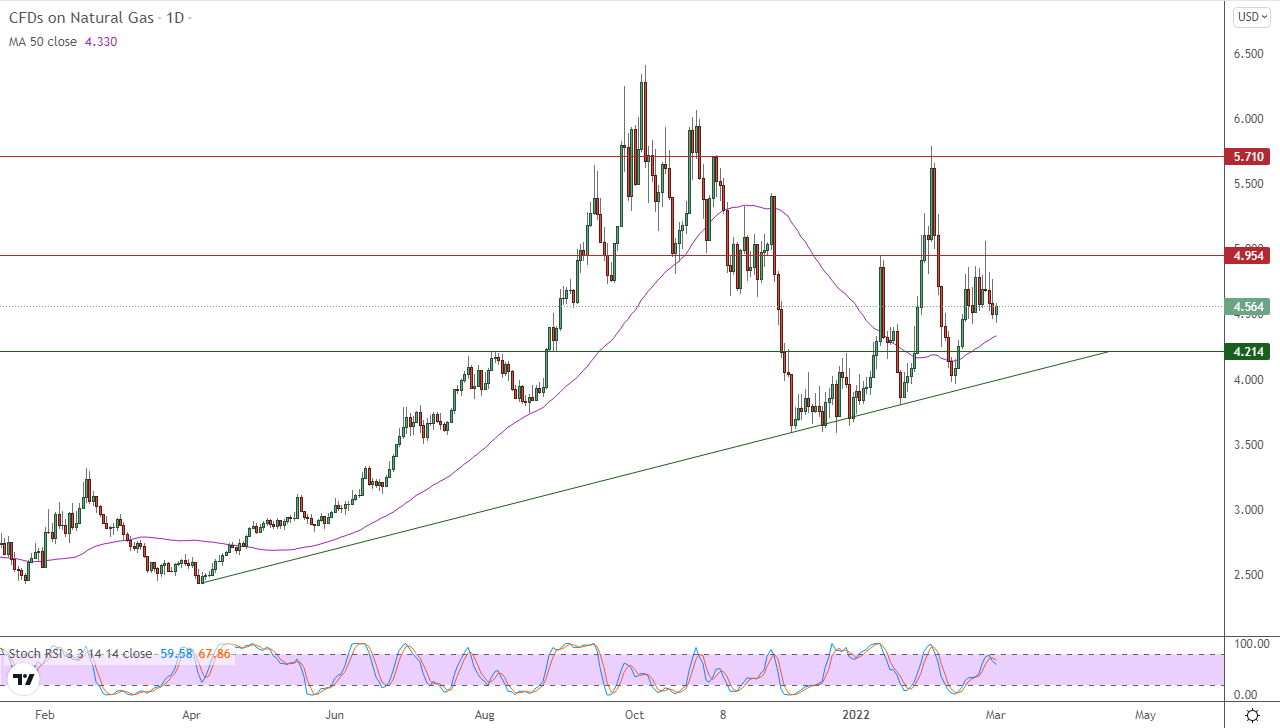
Spot natural gas prices (CFDS ON NATURAL GAS) rose during the recent trading at the intraday levels, to achieve daily gains until the moment of writing this report, by 1.53% to settle at the price of $4.566 per million British thermal units. This happened after its decline during yesterday’s trading by - 1.86%. During February, the price decreased by -11.96%.
Natural gas futures fell further on Monday due to reduced demand despite mounting war tensions, with April futures on Nymex flat 6.8 cents lower at $4.402. May futures fell 6.5 cents to $4,420.
NGI's Spot Gas National Avg's spot gas prices also continued to decline amid expectations of increasingly warm weather for the coming week, dropping $1,570 to $4,395.
Although Russia's war on Ukraine continued to wreak havoc on oil markets at the start of the week, natural gas traders quickly pushed back doubts about the crisis. April futures opened Monday's session 15.0 cents higher than Friday's close, but warm changes to the 15-day outlook quickly sapped momentum.
Looking at last week's US inventories report from the IEA due on Thursday, analysts' estimates were broad. NGI modeled withdrawals of 91 billion cubic feet for the week ending February 25, while another early forecast for withdrawals was in the 130 billion cubic feet range. For reference, 132 billion cubic feet were withdrawn from storage in the same period last year, and 98 billion cubic feet is the five-year average withdrawal.
Technically, prices retreated in its recent trading with the beginning of the emergence of a negative crossover with the relative strength indicators, after reaching areas of severe overbought operations, to try to drain some of this overbought, in light of the dominance of the main bullish trend in the medium term along a slope line, as shown in the attached chart. For a period of time (daily), supported by its continuous trading above its simple moving average for the previous 50 days.
Therefore, our positive expectations are still being implemented, as we expect natural gas to rise during its upcoming trading, as long as the support level 4.214 remains intact, to target the first resistance levels at 4.954, in preparation for attacking it.

