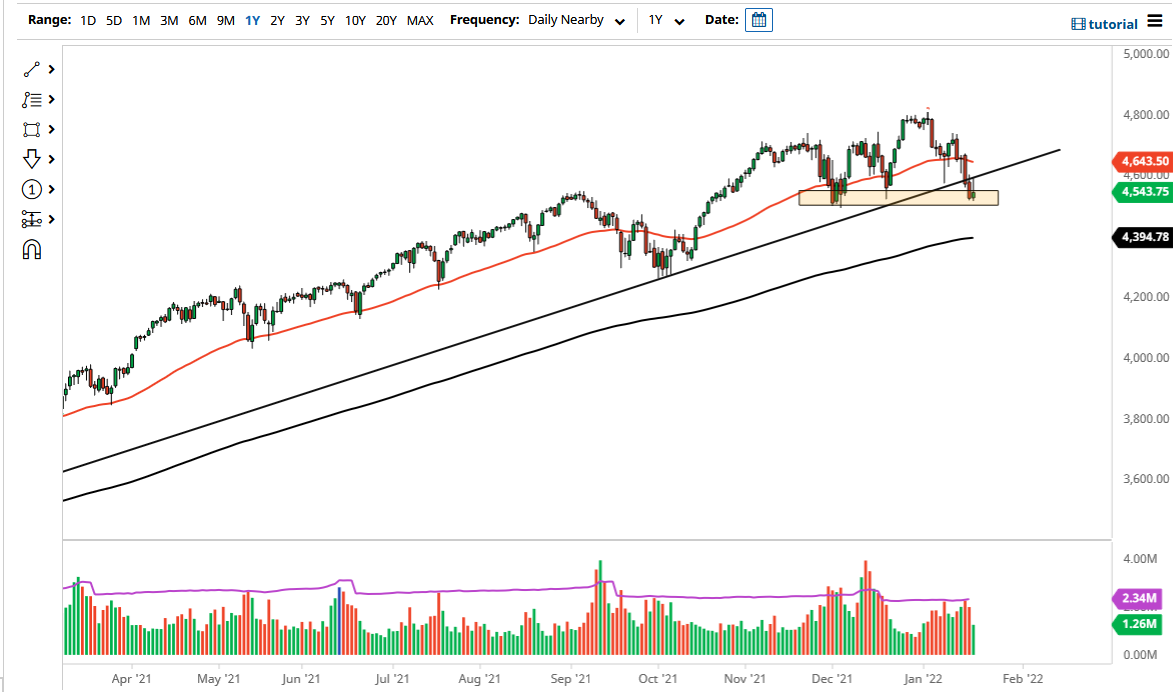
The S&P 500 shot higher during the trading session on Thursday to test the bottom of the previous trendline but has pulled back rather significantly from that level. This suggests to me that there is probably further downward pressure on this market, as hard as that is to believe. The 4500 level underneath offers a significant amount of potential support, so pay close attention to it. If we break down below there, I will be a buyer of puts, because I think that could be a bit of a “trapdoor” for lower pricing in this market.
On the other hand, if we were to break above the top of the candlestick for the trading session on Thursday would be a huge victory for the buyers, perhaps opening up the possibility of moving towards the 50 day EMA. What I find interesting is that the market seems to be ignoring the 10 year note over the last couple of days as we have actually seen interest rates rather stable. Because of this, I think they are already starting to worry about the Fed tightening into what almost certainly would seem to be a slowing cycle, which is a classic mistake that central banks tend to make time and time again. With that being the case, I think it is probably only a matter of time before we see some type of resolution.
I would anticipate a lot of choppiness, and quite frankly Friday does not seem like it offers a lot of hope for people wanting to hold into the weekend unless of course something big happens. After all, when you see this type of volatility do you feel like holding onto stocks while you could open up limit down in the futures market on Monday? Most professional traders feel the same way, and therefore I just do not see Friday be in an overly bullish day without some type of good fundamental news.
I am not calling for the end of the bullish run, and I am not calling for some type of meltdown. We are still within the range of potential sideways action more than anything else, as consolidation between 4500 and 4700 would not be out of the question. After all, we have had a nice run to the upside for quite some time.

