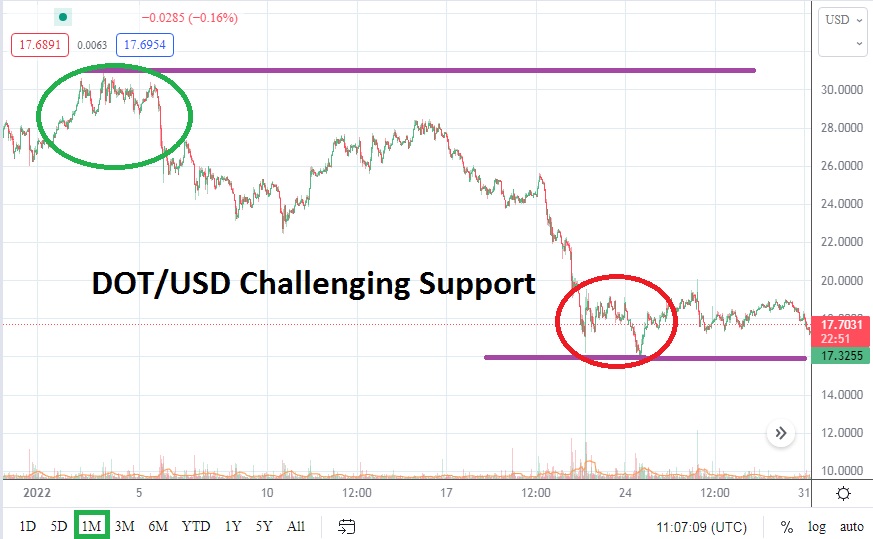
DOT/USD is trading below the 18.0000 level as of this writing and it is traversing a dangerous support level as February is set to begin. On the 23rd of January, Polkadot was trading near 16.0000 USD, which was the price of the cryptocurrency in late July2021 values. The highs for DOT/USD in January were the first two days of the month, when Polkadot was trading near 31.0000. Polkadot achieved a record value in the first week of November when it touched the 55.0000 ratio.
The lows attained early last week are still relatively close and although DOT/USD was able to reverse higher and hit the 20.0000 mark on the 26th of January, it did not show the ability to sustain its value above this price. The mid-term bearish trend and results from DOT/USD trading mirror the broad cryptocurrency market. Headwinds continue to seemingly blow hard and resistance levels in the short term continue to prove durable, and in fact have shown signs of incrementally lowering technically.
Certainly, short and mid-term trading perspectives can create two different points of trading approaches. Day traders may be inclined to believe DOT/USD is within oversold territory and seek quick hitting trades that target nearby resistance levels, if a trader has a bullish perspective and believes risk reward scenarios favor potentially greater movement to the upside.
However, while DOT/USD traded near the 16.0000 ratio in late July of 2021, it also traded near a value of approximately 10.4000 on the 21st of July. This is pointed out to underscore the potential of further movements which could be demonstrated to the downside if bearish sentiment continues to be the dominant feature of Polkadot. Traders may perceive a seven dollar decline as insignificant within cryptocurrencies, but a move to July’s lows would represent a stark decline in value percentage wise. Meaning traders need to use their leverage carefully.
DOT/USD has danced in lock step with the broad cryptocurrency markets. It has lost almost two/thirds of its value since the first week of November. While the potential downside from the current value of DOT/USD may look limited, a trader who remains skeptical about Polkadot in the near term cannot be faulted for believing under the present conditions lower price action may be seen. Selling DOT/USD may prove to an interesting wager if current resistance levels are able to show they are adequate.
Polkadot Outlook for February
Speculative price range for DOT/USD is 10.5000 to 28.4000.
If DOT/USD is not able to challenge the 19.0000 mark relatively soon and sustain a value above this juncture it may be a signal additional nervousness is going to develop. The 17.0000 mark needs to be monitored because if it proves vulnerable, speculators may begin to believe the 16.0000 price for DOT/USD is attainable. Sellers should remain realistic about their price targets and be willing to cash in profitable trades.
However, if the 15.0000 support level is also made to look weak and is penetrated lower, than traders may turn their attention to the 13.5000 value. While DOT/USD may look oversold, if the broad cryptocurrency market remains nervous and lower critical support is being tested further downside action could be displayed.
Bullish traders may want to be cautious in the near term and watch resistance levels with attention. If DOT/USD can break through the 19.0000 and seriously test the 20.0000 mark this could prove to be a realistic short-term target for speculators. However, for DOT/USD to show it has the potential to really challenge higher values, the 23.0000 needs to be surpassed technically to offer a hope of a renewed bullish surge which could test higher prices. If DOT/USD is able to test the 25.0000 ratio this would be an optimistic sign and signal a move towards the 28.0000 level could be exhibited.

