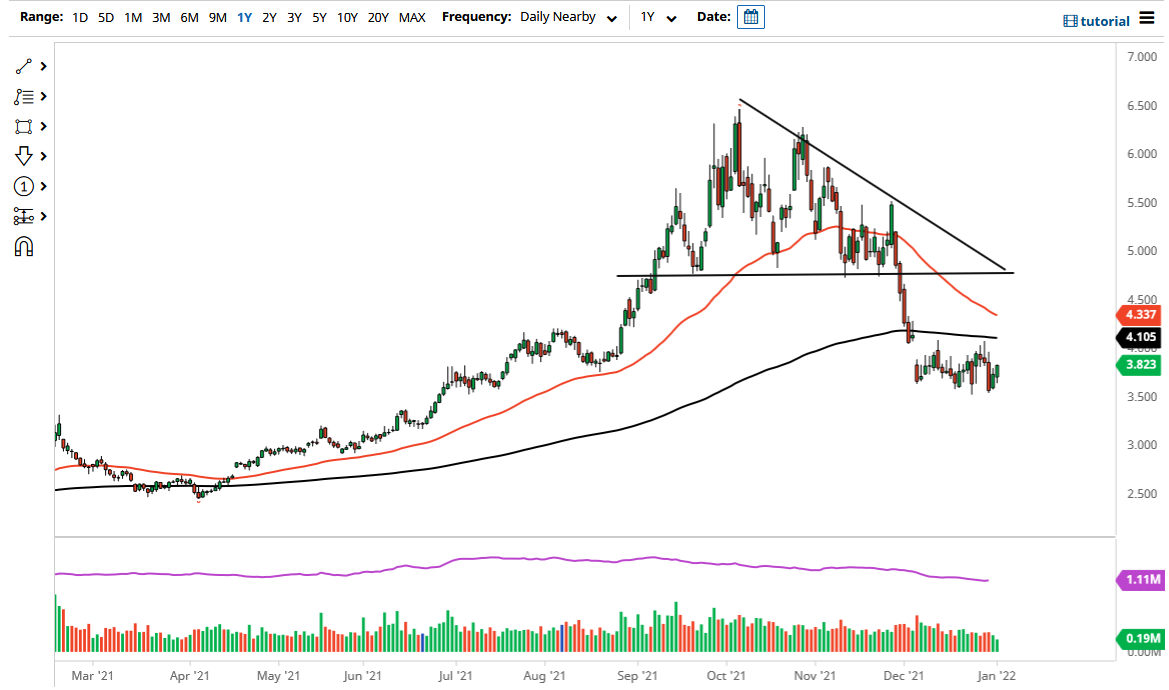
Natural gas markets initially fell during the day on Monday but then turned around to show signs of strength again in order to break above the $3.83 level. That being said, the market is still carving out a rather significant rectangle, as we simply have nowhere to be at the moment. With this being the case, I continue to look at this market through the same prism that I have for quite some time.
To the upside, the 200 day EMA sits at the $4.10 level, and is drifting ever so gently to the downside. I suspect that any rally at this point will continue to struggle near that area, so I like the idea of fading signs of exhaustion closer to that level, as it has been relatively reliable as of late. This makes sense, because we are already trading the February contract, and beyond that, temperatures in the United States have been rather warm and show no signs of plummeting any time soon. Even if they did, it is not enough to catch up for the rest of the winter which has been so disappointing for natural gas bulls.
We are starting to see LNG ships off the coast of the United States as foreigners are buying LNG, but that is not enough to overwhelm the supply in the United States. Because of this, I think that any time we rally, there should be sellers waiting above. In fact, we are getting relatively close to the idea of the 50 day EMA crossing below the 200 day EMA, when you get a so-called “death cross.” This of course is a longer-term negative technical signal, but more than anything else it is a psychological trigger.
To the downside, the $3.50 level should continue to offer support, but I think we will break down through it eventually. When you look at the triangle above, the so-called “measured move” was for the market to drop to the $3.00 level, something we have yet to do. When you look at the market at the $3.00 level historically, it does tend to be like a magnet for price and the natural gas markets tend to be very comfortable in that overall region. It is because of this that I am fading every sign of exhaustion after short-term rallies that I can, as I believe we will continue to pick away to the downside.

